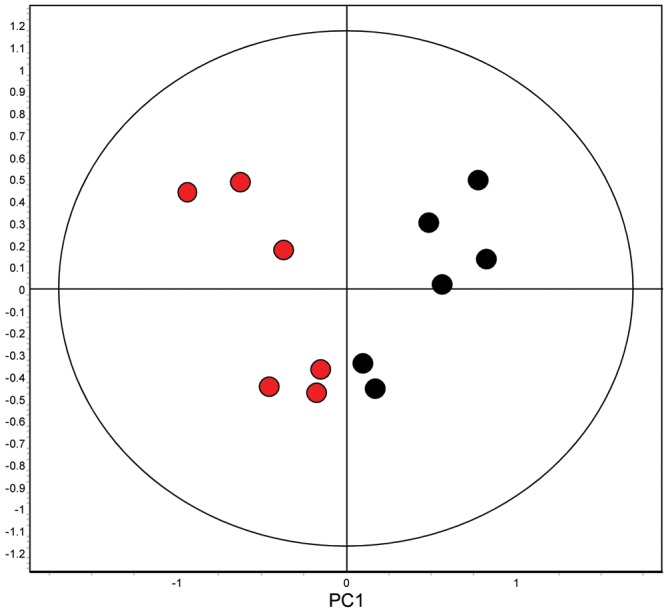
Figure 4.

Principal-component analysis of the 12 ischemic (red) and nonischemic (black) right ventricle samples. Principal component 1 partitions the ischemic and nonischemic right ventricular subjects into different groups, supporting that the magnitude and/or number of statistically significant changes in protein expression is sufficient to discriminate the ischemic and nonischemic right ventricular groups.
