
Fig 2. Age distribution of influenza cases by virus type and subtype.
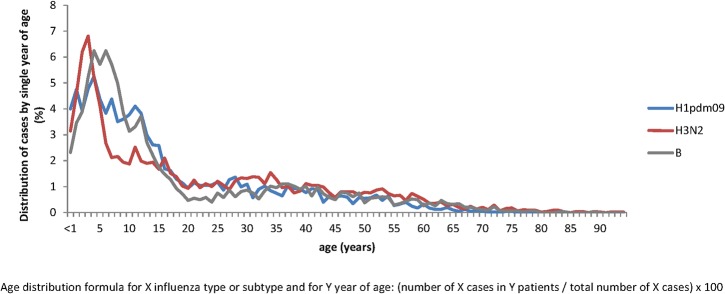
The IBVD (Influenza B in Vircases database) study, France, 2003–2004 to 2012–2013. The age distribution of H3N2 cases is shown in red, B cases in grey and H1pdm09 in blue.
Official websites use .gov
A
.gov website belongs to an official
government organization in the United States.
Secure .gov websites use HTTPS
A lock (
) or https:// means you've safely
connected to the .gov website. Share sensitive
information only on official, secure websites.
The IBVD (Influenza B in Vircases database) study, France, 2003–2004 to 2012–2013. The age distribution of H3N2 cases is shown in red, B cases in grey and H1pdm09 in blue.