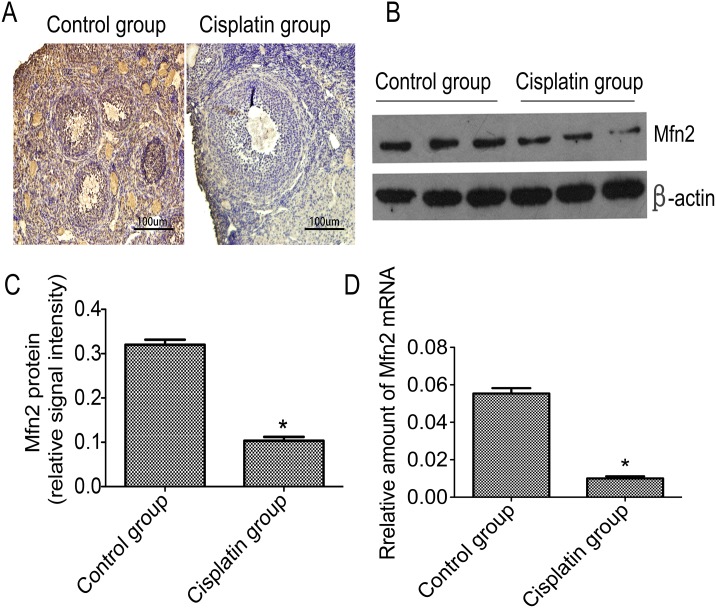
Fig 2. Mfn2 distribution and Mfn2 levels in ovarian tissues of the two groups.
A: Mfn2 distribution was exhibited by immunohistochemistry and exclusively located in the cell's cytoplasm; B: The most representative image of western blotting; C: The relative amounts of Mfn2 protein levels in the control and cisplatin group; D: The comparison of Mfn2 mRNA levels in the ovarian tissue. *P<0.05 vs control group.

