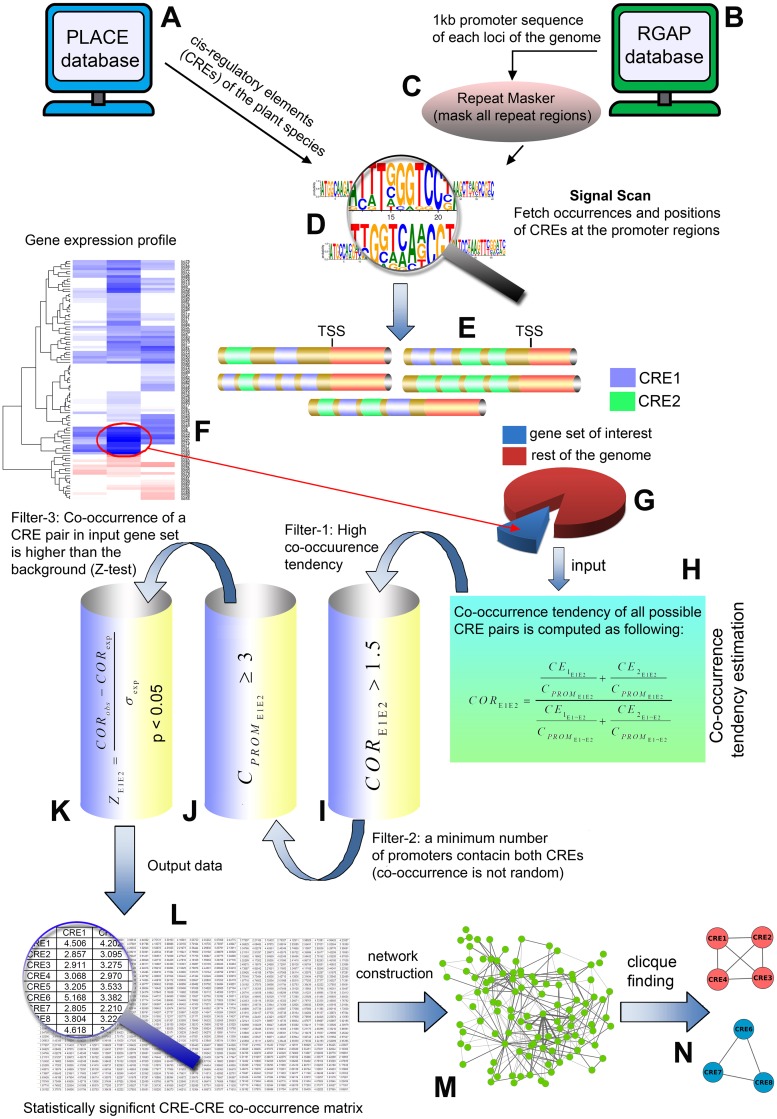
Fig 1. A diagrammatic representation of our methodology.
(A) Cis-regulatory element information is collected from PLACE database. (B) Promoter sequence data is collected from Rice Genome Annotation Project database. (C) RepeatMasker masks all the repeated regions in the promoter sequences. (D) Signal Scan tool scans the promoter sequences to estimate the occurrences and positions of the CREs. (E) A cartoon diagram shows the location of individual CREs in the promoter regions. (F, G) Selection of input gene-sets (differentially up-regulated genes) and background (rest of the genome). (H) COR values are estimated for all possible CRE pairs. (I) First filtering step: COR > 1.5 values are chosen. (J) Second filtering step: only the CRE pairs present in ≥ 3 promoters are selected for further analyses. (K) Third filtering step: significance of a COR value in the input gene-set is compared against the background by a Z-statistics (p < 0.05 is chosen). (L) Matrix representation of CRE pairs with statistically significant co-occurrence. (M) This matrix is transformed into an edge-weighted network (nodes represent individual CREs, edge weights represent the COR values). (N) Network analysis reveals the unique cliques of CREs.

