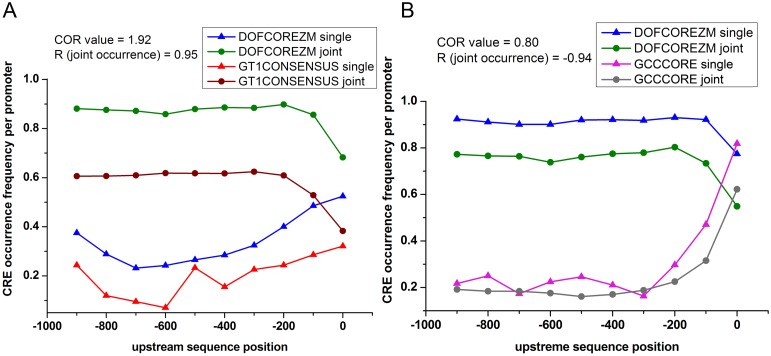
Fig 5. Positional distribution (exclusive/single vs joint occurrence) of CRE pairs.
(A) The frequencies of occurrence (single and joint) of two CREs (DOFCOREZM and GT1CONSENSUS) with significantly high COR value (1.92) is presented. The positional distribution patterns of the two CREs are very similar (R = 0.95) where they occur together. Moreover, there is a distinct difference in between frequencies of single and joint occurrences of CREs. The joint occurrence frequencies are about 3 times higher than their corresponding single occurrence frequencies, which indicates the tendency of co-occurrence. (B) Positional distribution of DOFCOREZM and GCCCORE exhibit completely different scenario, in which the distribution pattern of single and joint occurrences of each CRE have no difference rather the frequencies of single occurrence are more favored over joint occurrences. As a result, this CRE pair exhibits weak COR value (0.80) and highly dissimilar positional distribution pattern (R = −0.94) of joint occurrences.

