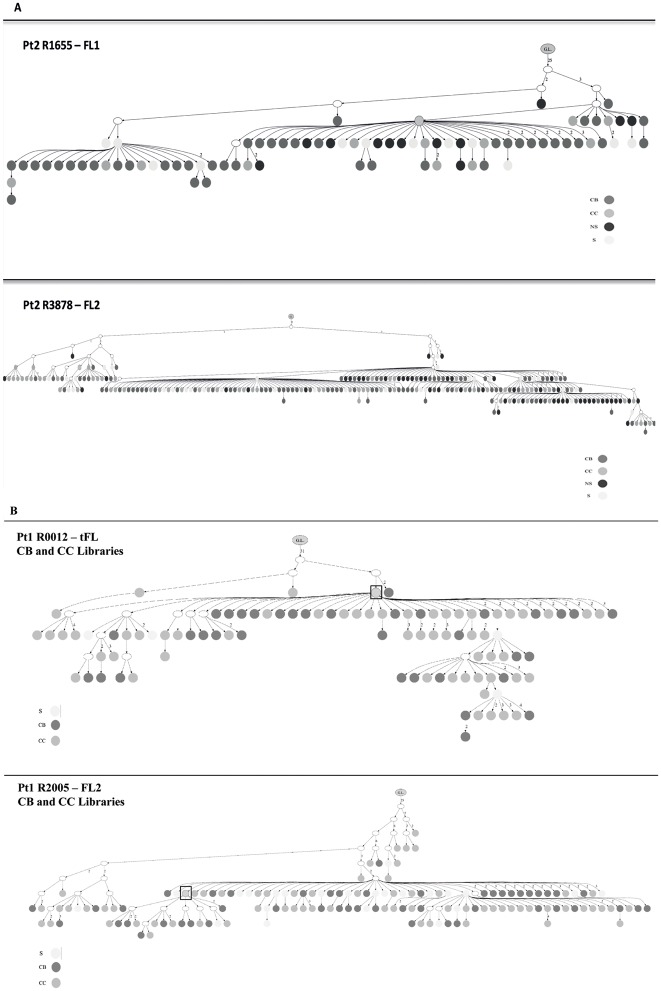
Fig 4. Merged Lineage Trees showing the dynamics of evolution of the sub-clones.
(A) Merged lineage trees generated from the 2 biopsies R1655 FL1 and R3878 FL2 from pt2. G.L. means germline; the dark grey circles represent the CB clones, the medium grey circles the CC, the light grey circles the clones shared (S) among 2 or more populations and the black circles those from the not sorted (NS) whole biopsy. (B) Merged lineage trees obtained from the combination of the CB and CC libraries from the samples R0012 t-FL and R2005 FL2 from pt1. The dark grey circles represent the CB subclones, the medium grey circles the CC and the light grey circles the clones shared (S) by CB and CC. The white circles represent subclones not detected with the 454 sequencing. Squares highlight the MC.

