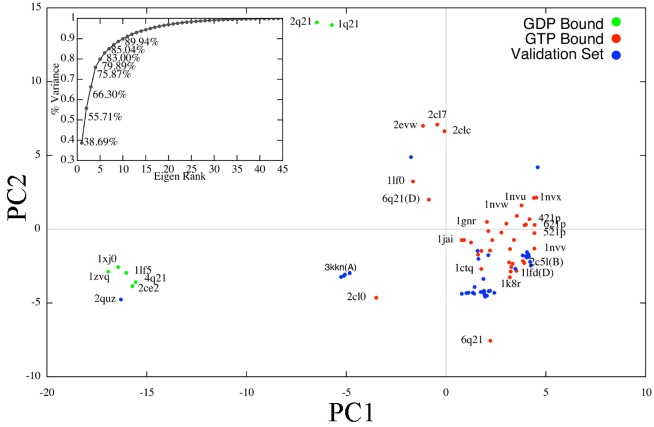
Fig 1. Projection of PDB-obtained Crystallographic Structures over Top Two PCs.
Projections on the top two PCs are shown for all 86 collected structures of H-Ras. The 46 structures actually subjected to the PCA are in red (these correspond to the GTP-bound/inactive state) and in green (these correspond to the GDP-bound/active state). The 40 structures withheld from the PCA for validation purposes are shown in blue. The accumulation of variance subplot in the top left shows that PCA is effective for H-Ras. The 90% variance is achieved at 10 PCs. The two functional states of H-Ras are clearly separated by PC1. Projections of the 40 structures withheld from the PCA are contained in the same space.

