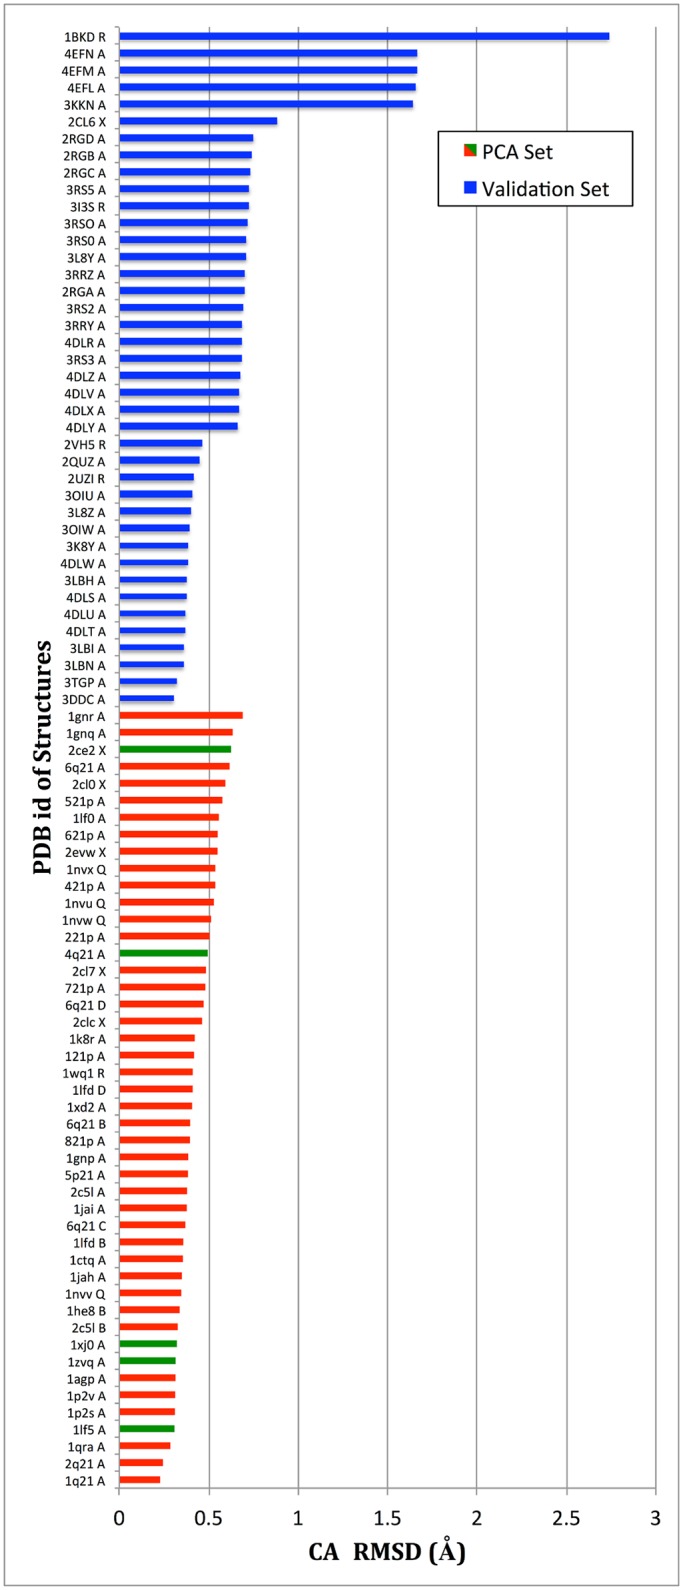
Fig 3. Reproduction of Crystallographic Structures Among SIfTER-generated Functional Conformations.

Each crystallographic structure is compared to the sub-ensemble of functional conformations obtained by SIfTER, and the lowest CA RMSD is reported. CA RMSDs corresponding to GTP-bound structures are drawn in red, those corresponding to GDP-bound structures are drawn in green, and those corresponding to the 40 crystallographic structure withheld from the PCA for the purpose of validation are drawn in blue.
