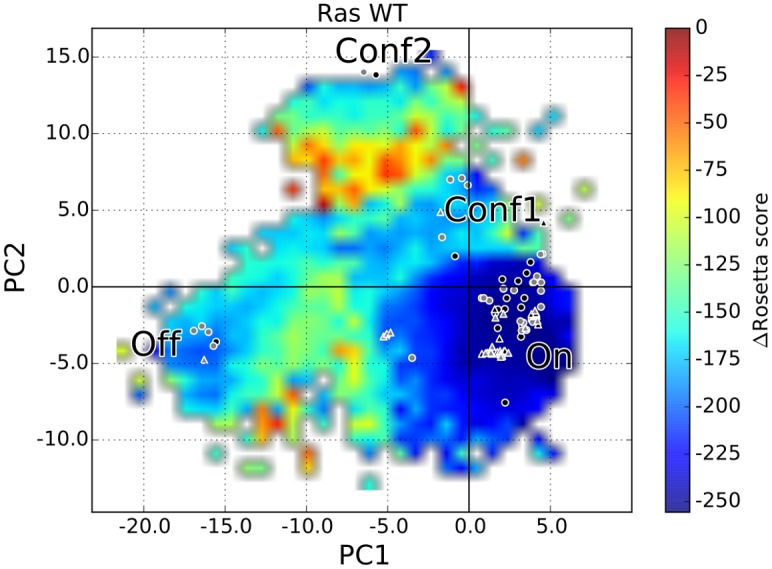
Fig 4. Mapping of Crystallographic Structures on SIfTER-obtained Energy Landscape for WT H-Ras.

The energy landscape associated with functional conformations generated by SIfTER for WT H-Ras is shown here. All 86 crystallographic structures are projected onto the top two PCs to mark their locations on the landscape. The 46 structures used by SIfTER to define the reduced search space and obtain PCs are drawn as circles. The 40 structures withheld from SIfTER for the purpose of validation are drawn as triangles. Crystallographic structures reported for the WT sequence are filled in black, whereas those reported for other variants are filled in gray.
