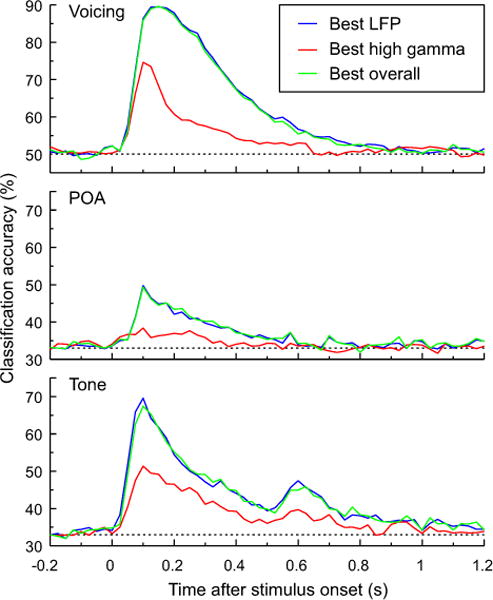
Figure 8.

Classification analysis of CV syllables based on voicing and POA (top and middle panels) and pure tones (bottom panel). Across-subject (N = 21 for voicing and POA, N = 10 for tone classification) average accuracy based on LFP and/or high gamma measures that yielded the best performance in each subject. Dashed lines indicate chance level (50% for voicing and 33% for POA and tone classification).
