
Figure 1. GR expression by Western blot and qRT-PCR in ovarian cancer cell lines.
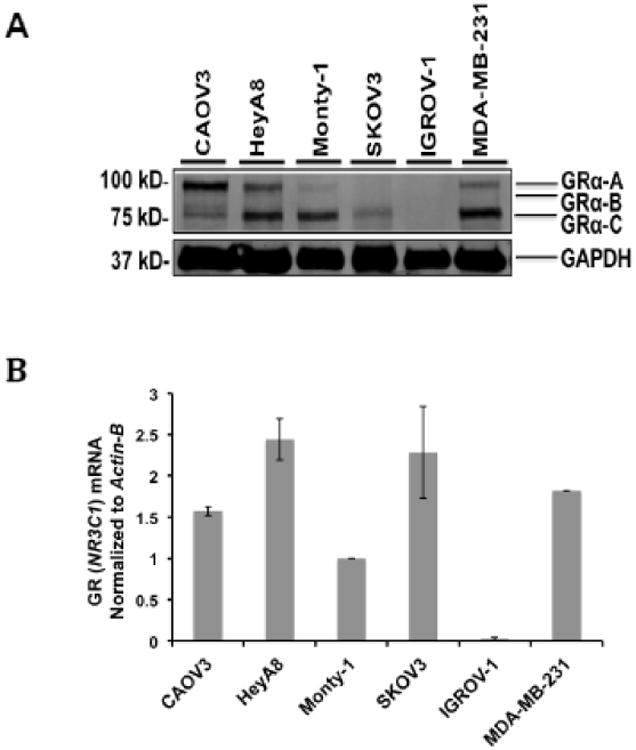
A) GR protein expression in OvCa cell lines by Western blot (B) GR mRNA transcript levels in OvCa cell lines. Transcript levels were first normalized to Actin-B mRNA expression and are shown as a ratio compared to Monty-1 cell line normalized GR (NR3C1) transcript expression. MDA-MB-231 GR (NR3C1) mRNA expression was used as a control. The error bars represent ± standard error of the mean (SEM).