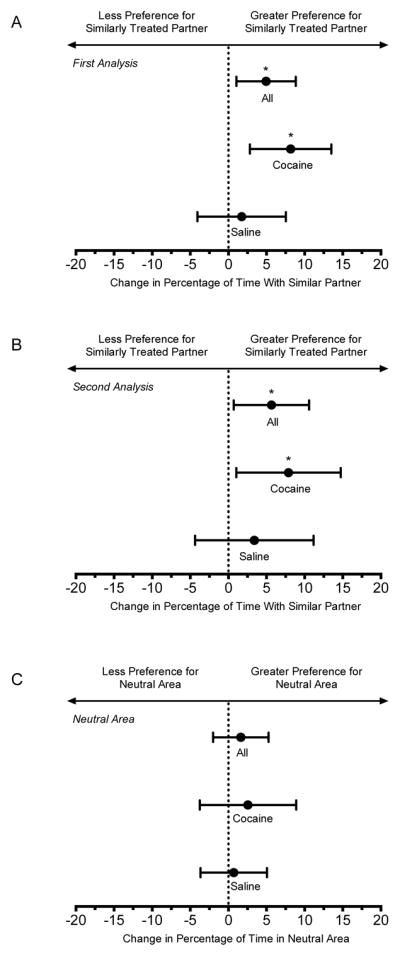
Figure 2.

Change in partner preference measures. The hoirzontal axis depicts the change in partner preference (A and B) or time spent in the neutral area (C) after conditioning relative to baseline. All change scores were calculated as post-conditioning minus preconditioning. Percentage of time with similarly treated partner was calculated as time with similarly treated partner divided by the total time with partners (×100). Positive values indicated an increase in time spent with the similarly treated partner. Percentage of time in the neutral area (for the second analysis) was calculated as time in neutral compartment divided by total time. Positive values indicated an increase in time spent in the neutral area after conditioning. Means and 95% confidence intervals were determined for all choice rats (n = 32), and separately for the cocaine-treated (n = 16) and saline-treated (n = 16) subgroups. Asterisks (*) indicate statistical significance.
