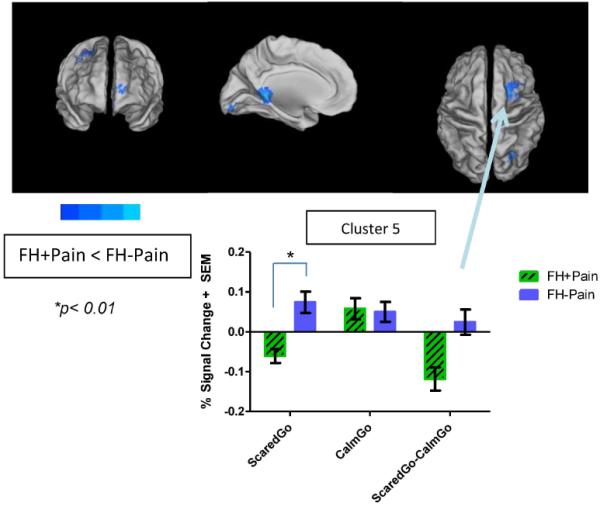
Figure 3. Significant differences in brain response to negatively valenced faces between FH+Pain and FH−Pain youth.

Brain response to Scared vs. Calm Go faces was reduced in FH+Pain youth compared with their FH−Pain peers, as indicated by areas in cool colors surface-mapped on the Population-Average, Landmark- and Surface-based (PALS-B12) template brain, multiple comparison corrected, (p/α<0.05/0.05). These five clusters are labeled on the maps with names corresponding to regions where the peak coordinate of differences in brain response was located, and include frontal, occipital, parietal, and cingulate cortex. Brain activity is bar graphed from one of these clusters (Cluster 5) as an example of patterns seen in both the contrast of Scared vs. Calm Go faces, and the simple effects of those contrasts. In this region group differences suggest blunted activity to Scared faces, but no significant differences in activity to Calm faces in FH+Pain youth, compared with their FH−Pain peers. L = left, R = right.
