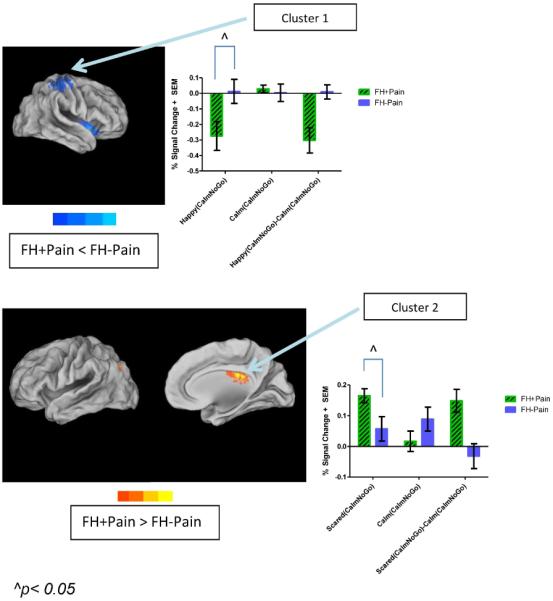
Figure 4. Significant differences in brain response during inhibitory control in both positively and negatively valenced contexts between FH+Pain and FH−Pain youth.

Brain response to Happy(CalmNoGo) vs. Calm(CalmNoGo) faces was reduced, while brain activity to Scared(CalmNoGo) vs. Calm(CalmNoGo) faces was increased in FH+Pain youth compared with their FH−Pain peers. This is indicated by areas in cool, and warm colors, respectively, surface-mapped on the Population-Average, Landmark- and Surface-based (PALS-B12) template brain, multiple comparison corrected, (p/α<0.05/0.05). All clusters are labeled on the maps with names corresponding to regions where the peak coordinate of differences in brain response was located. In the top panel, this includes the postcentral gyrus and inferior frontal gyrus. Brain activity is bar graphed from two of these clusters (Cluster 1), with simple effects indicating reduced inhibitory control brain response in positively valenced emotional contexts in FH+Pain youth compared with their FH−Pain peers. In the bottom panel, brain activity is increased in middle temporal and cingulate gyri, suggesting reduced suppression of some areas of the default mode network during cognitive control in FH+Pain youth, compared with their FH−Pain peers. L = left, R = right.
