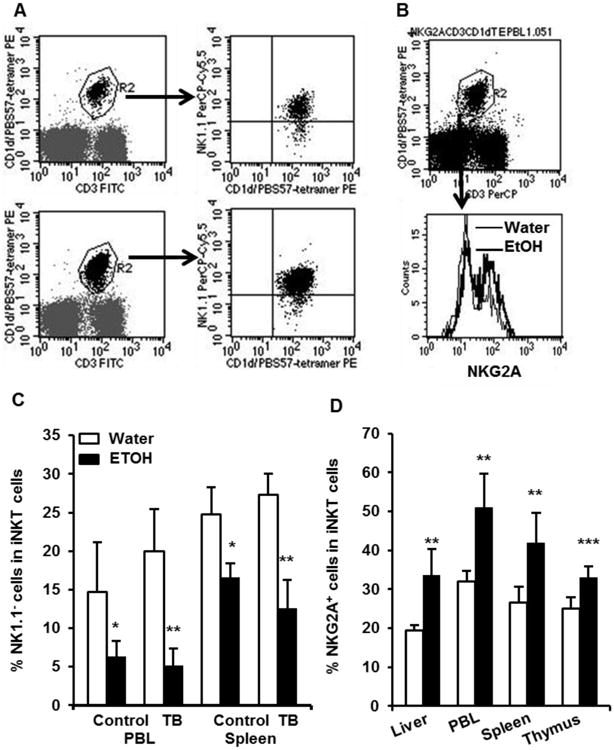
Fig. 6.

Effects of chronic alcohol consumption on the expression of NKG2A and NK1.1 in the iNKT cells of melanoma-bearing mice. A. Dot plots showing NK1.1- iNKT cells (right lower quadrant in the right panel) in the gated iNKT cells (CD3+/PBS57-tetramer+, R2 region in the left panel). The upper panel is from the PBL of water-drinking, tumor-bearing mice. The lower panel is from the PBL of alcohol-consuming, tumor-bearing mice. B. Dot plot showing gated iNKT cells (upper panel, R2) and histogram showing NKG2A+ cells in gated iNKT cells. C. Percentage of NK1.1- iNKT cells in the total iNKT cells in the PBL and spleen of non-tumor injected mice (Control) and tumor-bearing mice (TB). D. Percentage of NKG2A+ iNKT cells in the total iNKT cells in the indicated tissue and organs. Values are mean ± SD for groups containing 6-10 mice. Each experiment was at least repeated twice with similar results. Two tailed Student's t-test was used to analyze the difference between groups. **Different from water- drinking mice within group, p<0.01; ***Different from water-drinking mice within group, p<0.001. Water=water-drinking mice. EtOH=alcohol-consuming mice.
