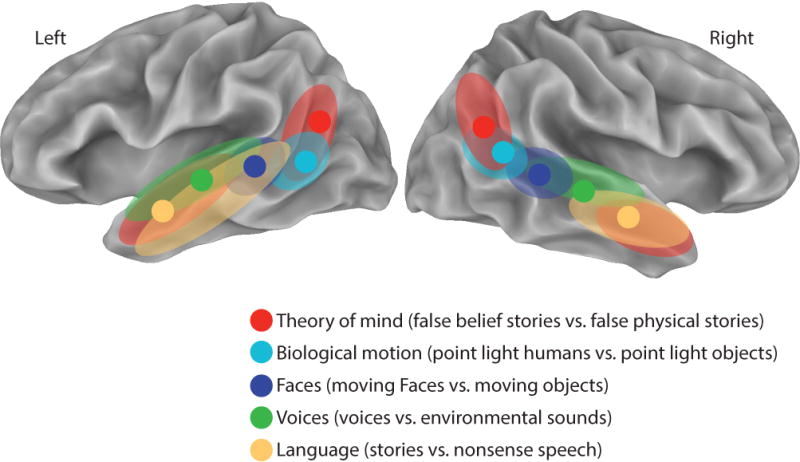
Figure 1. Organization of Social Perception and Cognition within the STS.

Results of Deen et al. [1] shown on an inflated cortical surface model of the left and right hemisphere of the N27 atlas brain. Filled circles show the location of the peak activation, averaged across subjects, for each contrast. Colored regions show the extent of the activation for each contrast (multiple colored regions for some contrasts). Created from Deen et al. Table 1 and description of activations.
