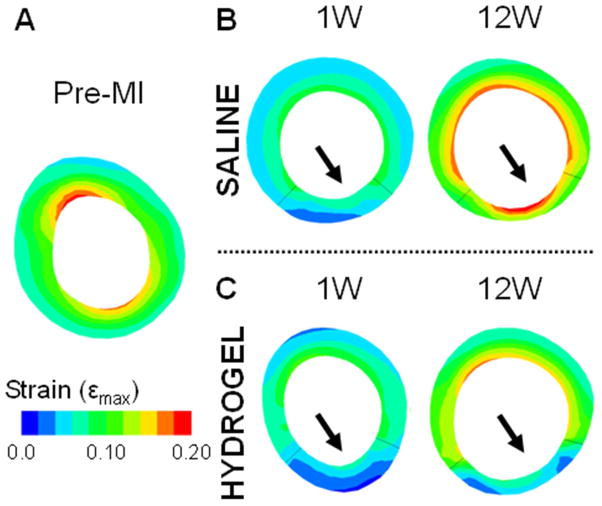
Fig. 7.
Short-axis view of the diastolic principal strain generated from FE model simulations. Representative short-axis strain maps of a baseline animal (A) and saline (B) and hydrogel (C) treated animals at 1 and 12 weeks. The end-diastolic pressure was set at a constant 10 mmHg to ensure all data sets experienced the same load.

