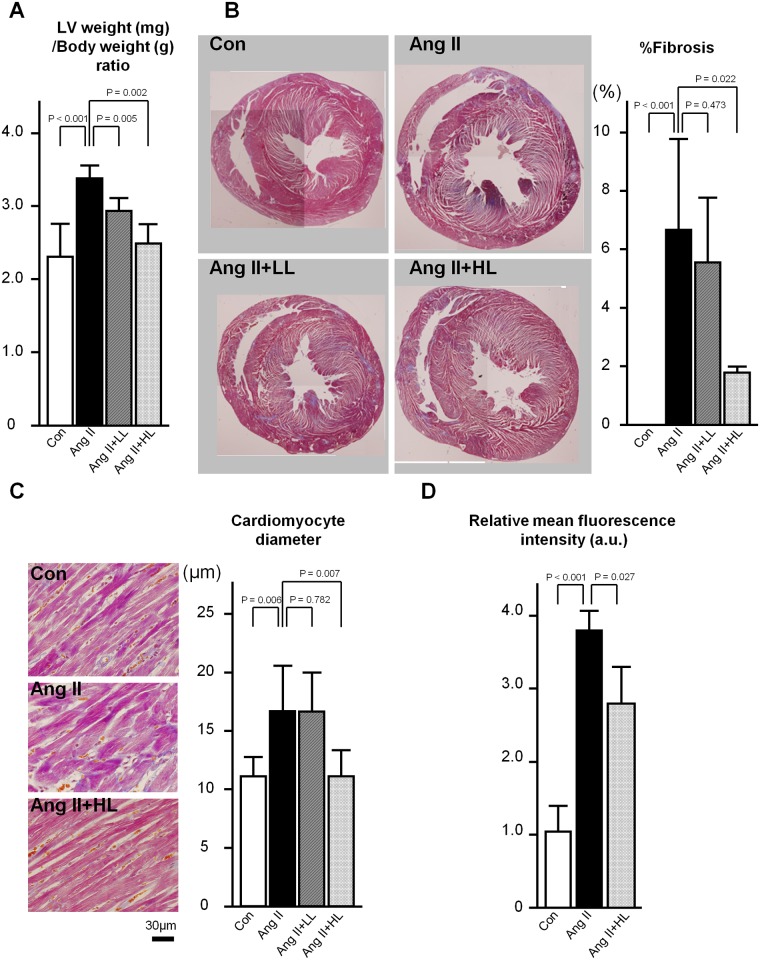
Fig 2. Pathological findings and evaluation of oxidative state.
A, Left ventricular weight (mg)/body weight (g) ratio. B, Left, Representative mid-ventricular cross sections in Masson-trichrome staining. Right, Percent fibrosis of left ventricles. C, Left, Representative mid-ventricular cross sections in hematoxylin-eosin staining. Right, Cardiomyocyte diameter in left ventricles. D, Relative mean oxidative fluorescence intensity in left ventricles. Mean of the results in the control group was assigned an arbitrary value of 1.0. Abbreviations for all groups are the same as those in Fig 1. Values are presented as the mean ± SD. n = 6–11 (A-C) and 3–5 (D) per group.

