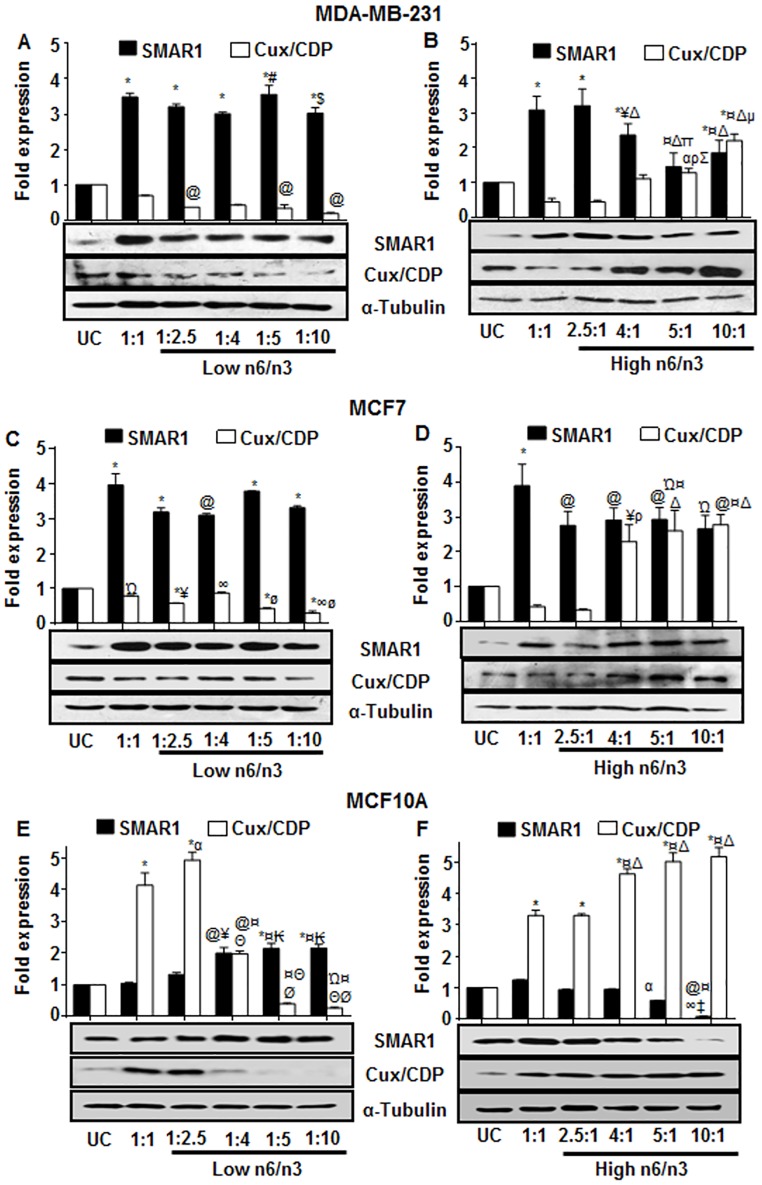
Fig 6. Regulation of MAR binding tumor regulatory proteins by n6/n3 ratios in breast cancer and non-cancerous cells.
Expression of SMAR1 and Cux/CDP proteins was analyzed in MDA-MB-231 (A, B); MCF7 (C,D) and MCF10A (E,F). The effect of low (A, C, E) and high (B, D, F) n6/n3 FA ratios has been shown in MDAMB231, MCF7 and MCF10A cell lines, respectively. The bands were quantified by densitometry using ImageJ 1.44p (National Institutes of Health, USA, http://imagej.nih.gov/ij) and have been presented as mean±SEM of three different experiments. Ώp<0.05, @p<0.01 and *p<0.001 compared to UC; αp<0.05, ¥p<0.01 and ¤p<0.001 compared to 1:1; ₭p<0.01and Θp<0.001 compared to 1:2.5; #p<0.05 and Øp<0.001 compared to 1:4; $p<0.05 compared to 1:5;ρp<0.05, ∞p<0.01 and Δp<0.001 compared to 2.5:1; ‡p<0.01 and Σp<0.001 compared to 4:1, μp<0.01 and πp<0.001 compared to 5:1.

