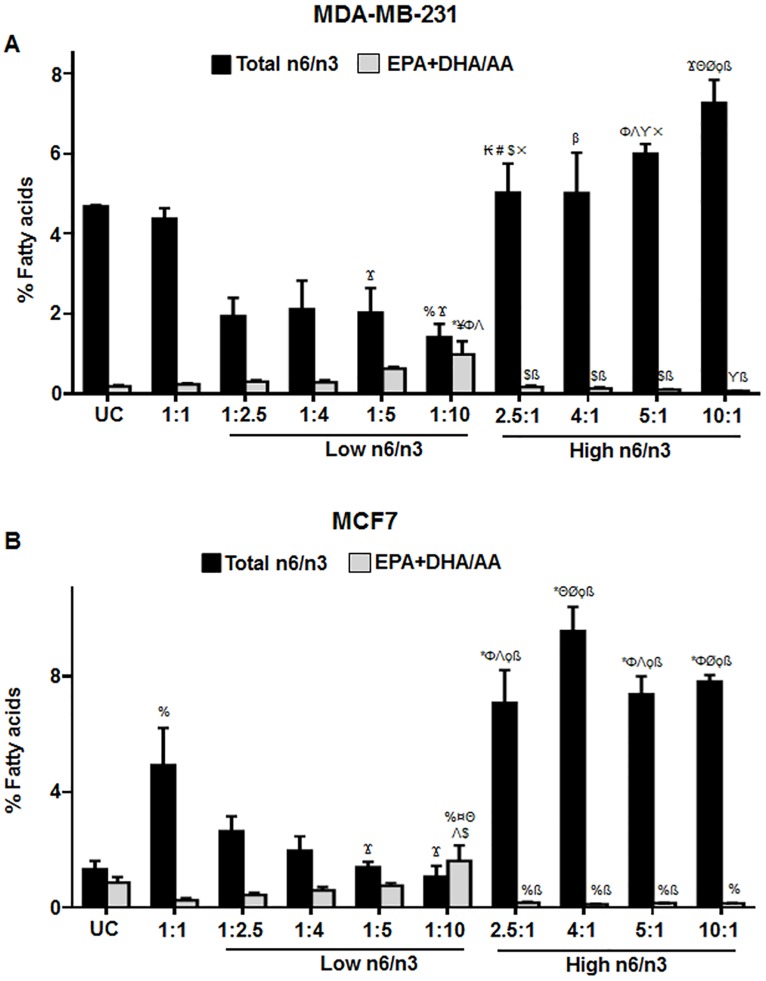
Fig 9. Relative percentage of total n6/n3 and EPA+DHA/AA ratio in breast cancer cells.
The cells were treated with different ratios of n6 and n3 FA for 24h. The levels of total n6/n3 and EPA+DHA/AA has been shown in MDA-MB-231 (A) and MCF7 (B) cells treated with low and high n6/n3 ratios, respectively. Total n6 fatty acids include Linoleic acid (LA) (18:2n6), Gamma-linolenic acid (GLA) (18:3n6), Dihomo-gamma-linolenic acid (DGLA) (20:3n6), Arachidonic acid (AA) (20:4n6); Total n3 fatty acids include ALA (18:3n3), EPA (20:5n3), DHA (22:6n3), DPA(22:5n3). Each value represents mean±SEM of three independent experiments. %p<0.05 and *p<0.001 compared to UC; Ϫp<0.05, ¥p<0.01 and ¤p<0.001 compared to 1:1; ₭p<0.01, Φp<0.01 and Θp<0.001 compared to 1:2.5; #p<0.05, Λp<0.01 and Øp<0.001 compared to 1:4; $p<0.05, ϒp<0.01 and ϙp<0.001 compared to 1:5; βp<0.05, ×p<0.001 and ßp<0.001 compared to 1:10.

