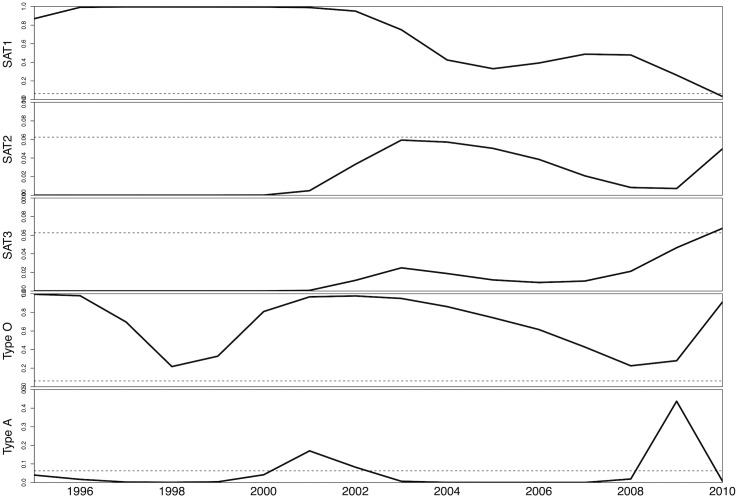
Fig 2. Yearly force of infection by serotype.
Estimates derived by model fitting for the time-varying force of infection (FOI) for SAT1, SAT2, SAT2, type O, and type A inferred for the 16-year period preceding data collection represented by a solid line. The dotted line represents the epidemic threshold R 0 = 1; the shaded areas represent estimated FOI that correspond to R 0 > 1 and therefore, sustained chains of transmission within the study population. Note that the scale of the y-axis varies across panels.

