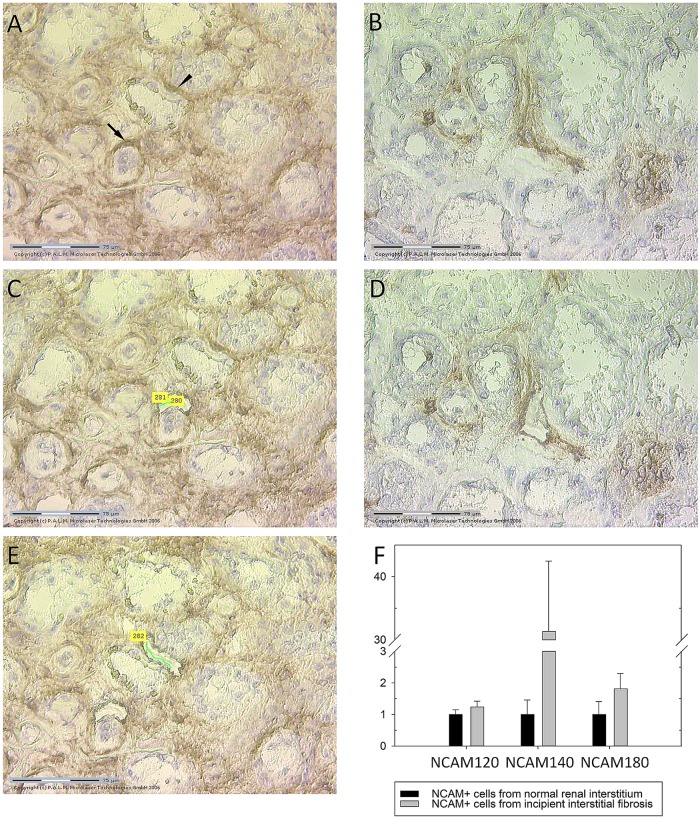
Fig 4. Isolation of NCAM positive renal interstitial cells by laser capture microdissection (LCM) and changes in relative mRNA NCAM isofroms expression levels in incipient renal fibrosis.
(A) Slide performed on cryostat section and stained by NCAM, clone Eric-1, with widespread NCAM expression, prior laser capture microdissection (arrow indicates the first selected NCAM positive cell for further LCM, while arrowhead shows second selected area). (B) Slide with rare NCAM cells within normal interstitium prior LCM. (C), (D) and (E) the same slides as Fig (A) and (B) after LCM procedure. (F) Relative expression levels of NCAM mRNAs isoforms, determined by quantitative real-time PCR (qRT-PCR), in NCAM+ cells captured by LCM from normal and from renal tissue with incipient IRF, data are presented with mean values and standard error bars; due to high variability of variables, exclusively in diseased kidneys, nonparametric Mann Whitney U test was applied to assess the difference in mRNA levels between controls and diseased kidneys; there were 6 samples (2 cases in triplicates) of control cases and 42 (14 cases in triplicates) samples of cases with incipient renal fibrosis.

