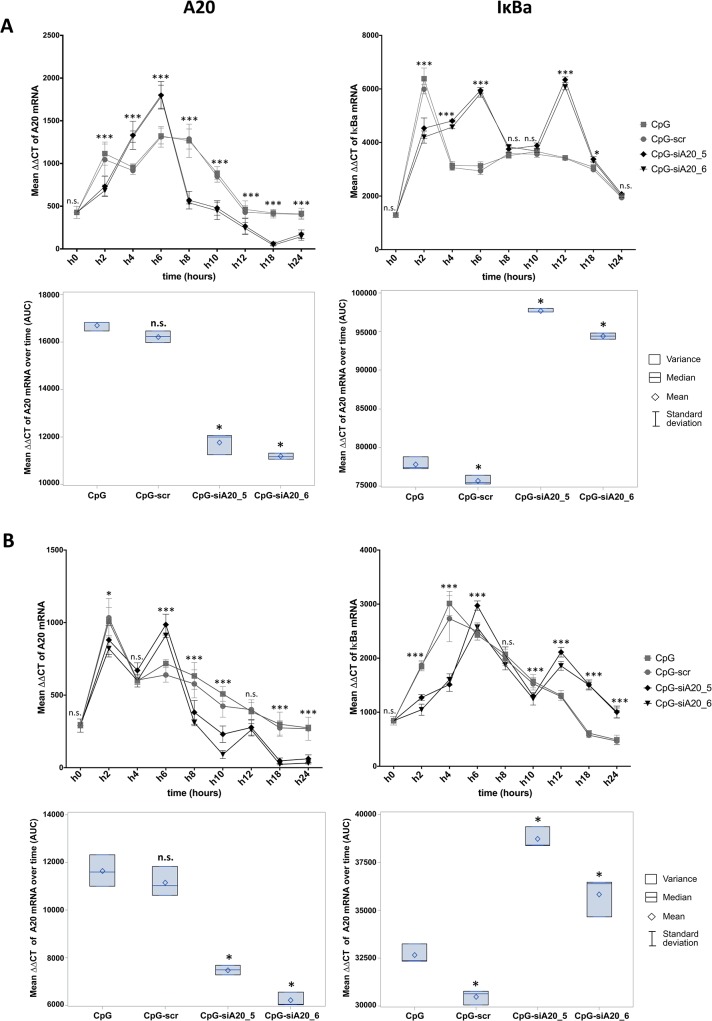
Fig 2. Expression of A20 and IκBa mRNA in CpG/ CpG-construct treated BMDCs and JAWSII cells.
A20 and IκBa mean expression0020measured at 0–24h by qRT-PCR (∆∆CT normalized to β-2-microglobulin) in BMDCs (A) and JAWSII dendritic cell line (B); Lower panels show integrated results of all time points calculated as areas under curves (AUC) defined by 9 time points; The results from three technical replicates of one representative experiment are shown; n.s. indicates no significant differences, * indicates p<0.05, ** indicates p<0.01, *** indicates p<0.001 compared to CpG treated cells.

