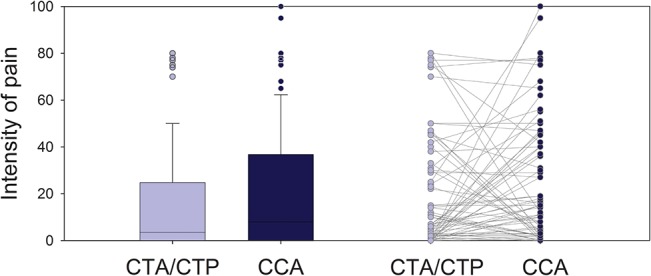
Fig 2. Pain intensity.

Boxplot of pain intensities patients reported for CTA/CTP and CCA on the horizontal visual analogue scale (0–100mm) and corresponding intraindividual comparison between the 68 patients who experienced pain during at least one examination; n = 36 pain CCA> CTA/CTP; n = 24 pain CTA/CTP> CCA; n = 8 pain CTA/CTP = CCA; p = 0.121 using the chi-square test.
