
Fig 1. Serum creatinine and weight loss of sham and IR-injured WT and KO mice.
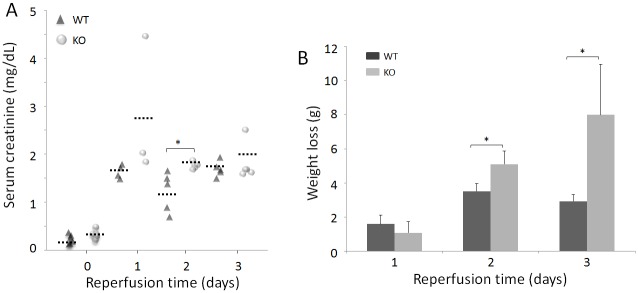
(A) Comparison of serum creatinine of sham and IR-injured mice. The solid black triangles (▲) represent WT mice, whereas the solid gray circles () represent KO mice. The short dotted-lines (…‥) represent the mean creatinine values of each group of mice. WT: Day 0 (sham mice, n = 6); Day 1 (n = 4); Day 2 (n = 5); and Day 3 (n = 5). KO: Day 0 (sham, n = 6); Day 1 (n = 3); Day 2 (n = 5); and Day 3 (n = 5). (B) Comparison of body weight loss between mice subjected to 1, 2, or 3 days of reperfusion. WT: Day 1 (n = 4); Day 2 (n = 3); Day 3 (n = 3). KO: Day 1 (n = 3); Day 2 (n = 5); Day 3 (n = 4). *p < 0.05.