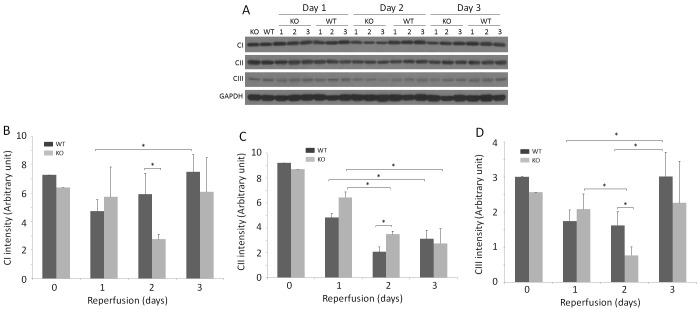
Fig 5. Detection of CI, CII and CIII of frozen kidney tissues of sham and IR-injured mice.
(A) Detection of CI, CII, and CIII of renal homogenates from sham and IR-injured WT and KO mice by Western blotting. The equal amounts of total proteins from renal tissue homogenates were loaded based on BCA protein assay and the amounts of samples loaded were monitored by determining GAPDH. The Western blots are representative of three experiments. (B) Bar graph of mitochondrial respiratory chain complex CI intensity based on quantitative analysis of CI band from the kidney of sham and IR-injured mice by densitometric analysis. The intensity of the protein band was normalized with GAPDH band intensity in each corresponding land. *p < 0.05. (C) Bar graph of mitochondrial respiratory chain complex CII intensity based on quantitative analysis of CII band from the kidney of sham and IR-injured mice by densitometric analysis. The intensity of the protein band was normalized with GAPDH band intensity in each corresponding land. *p < 0.05. (D) Bar graph of mitochondrial respiratory chain complex CIII intensity based on quantitative analysis of CIII band from the kidney of sham and IR-injured mice by densitometric analysis. The intensity of the protein band was normalized with GAPDH band intensity in each corresponding land. *p < 0.05.

