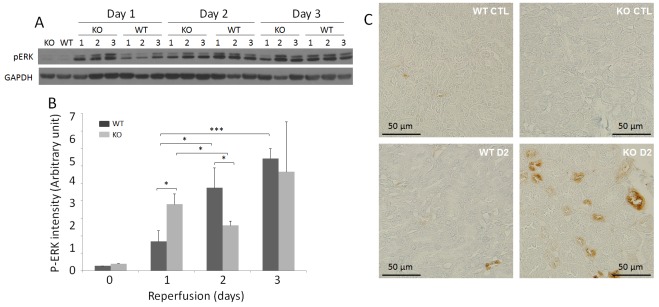
Fig 6. Detection of pERK of sham and IR-injured WT and KO kidneys.

(A) Detection of pERK of renal homogenates from sham and IR-injured WT and KO mice by Western blotting. The equal amounts of total proteins from renal tissue homogenates were loaded based on BCA protein assay and the amounts of samples loaded were monitored by determining GAPDH. The Western blots are representative of three experiments. (B) Bar graph of pERK intensity based on quantitative analysis of pERK band from the kidney of sham and IR-injured mice by densitometric analysis. The intensity of the protein band was normalized with GAPDH band intensity in each corresponding land. *p < 0.05; ***p < 0.005. (C) pERK immunohistochemistry of sham and IR-injured WT and KO mice. Immunohistochemistry (IHC) staining images are representative renal tissue sections from three mice of each group (bar = 50 μm; original magnification, x 400).
