
Fig. 6.
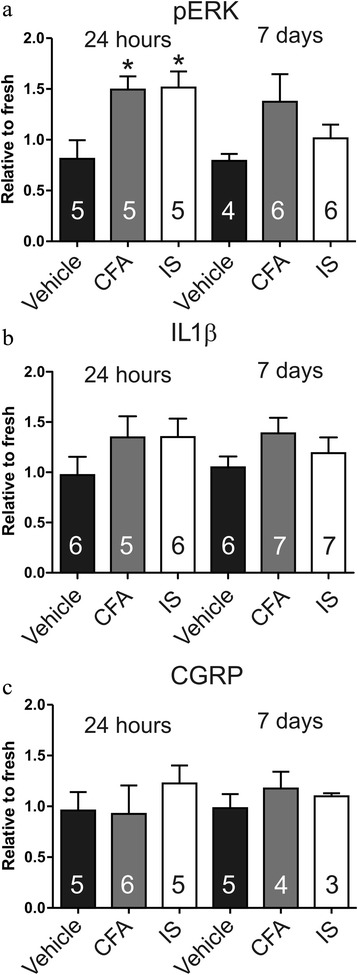
Average data from Western blots of the TG. a Western blot for pERK. The level of pERK is higher in CFA and IS treated groups. *, P < 0.05, one-way ANOVA, with Bonferroni post-test. b Western blot for IL-1β. There is a tendency of increased IL-Iβ activation following CFA or IS application on the dura. No significant difference was seen between the groups. c Western blot for CGRP. No significant changes in CGRP activation following CFA or IS application on the dura