Fig. 3.
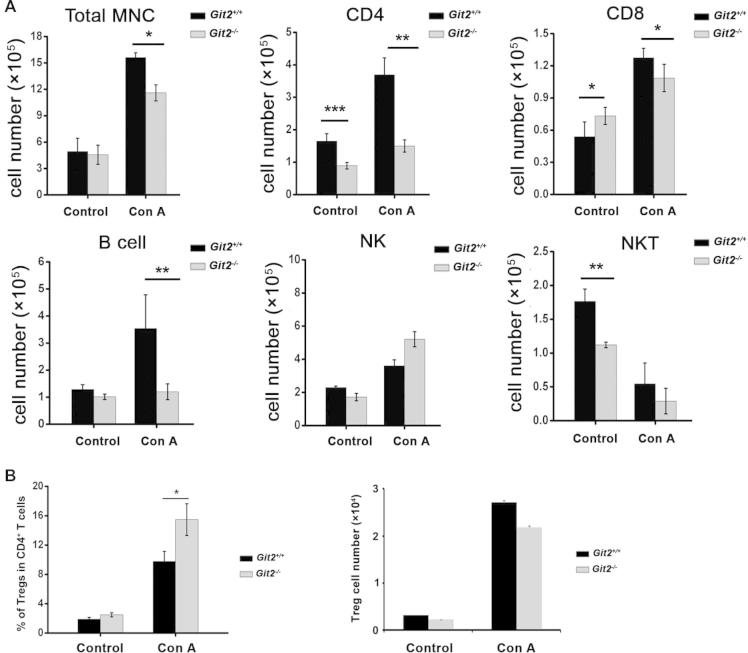
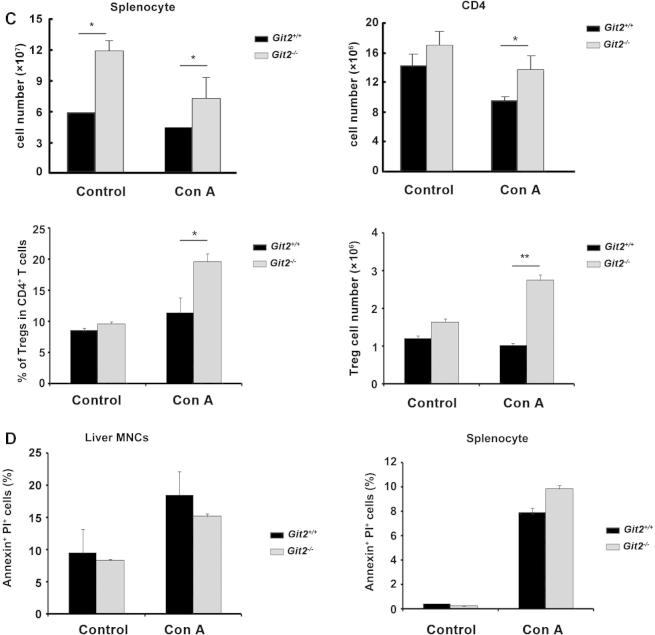
GIT2 depletion suppressed lymphoid cells infiltration to liver after Con A treatment. Liver MNC and splenocyte from Git2+/+ and Git2−/− mice (n = 6) were isolated at 6 h after 15 mg/kg Con A injection. (A) Cell numbers of total liver MNC, CD4+, CD8+, CD19+, NK, and NKT were quantified. (B) Cell numbers and percentage of Tregs were quantified. (C) Cell numbers of total splenocyte, splenic CD4+, splenic Tregs and Tregs percentage were quantified. (D) Cells were labeled with PI and annexin V–FITC and then analyzed by FACS. The results were representative of three independent experiments and error bars represent standard deviations (*P < 0.05, **P < 0.01).


