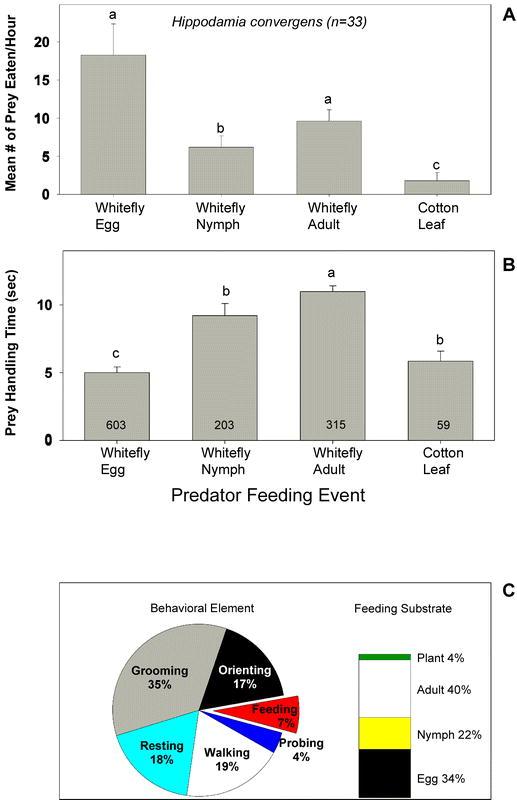
Figure 1.

(A) Mean (± SD) frequency of Hippodamia convergens feeding on the various whitefly lifestages or on the cotton leaf. The letters above the error bars indicate significant differences as determined by the Student Newman-Keuls multiple comparison test (P = 0.05, n = 33 individuals observed for 1 hour each). (B) The mean (± SD) amount of time H. convergens spent feeding on the various whitefly lifestages or on the cotton leaf. The numbers inside the vertical bars are the total number of observations recorded during 33 hours of observation. The letters above the error bars indicate significant differences as determined by Dunn's multiple comparison test (P = 0.05). (C) Time budgets for H. convergens in the feeding arena. Results are expressed as the percentage of total time spent in each behavioral element and on each feeding substrate over 33 hours of observation (n = 33 individuals).
