
Figure 8.
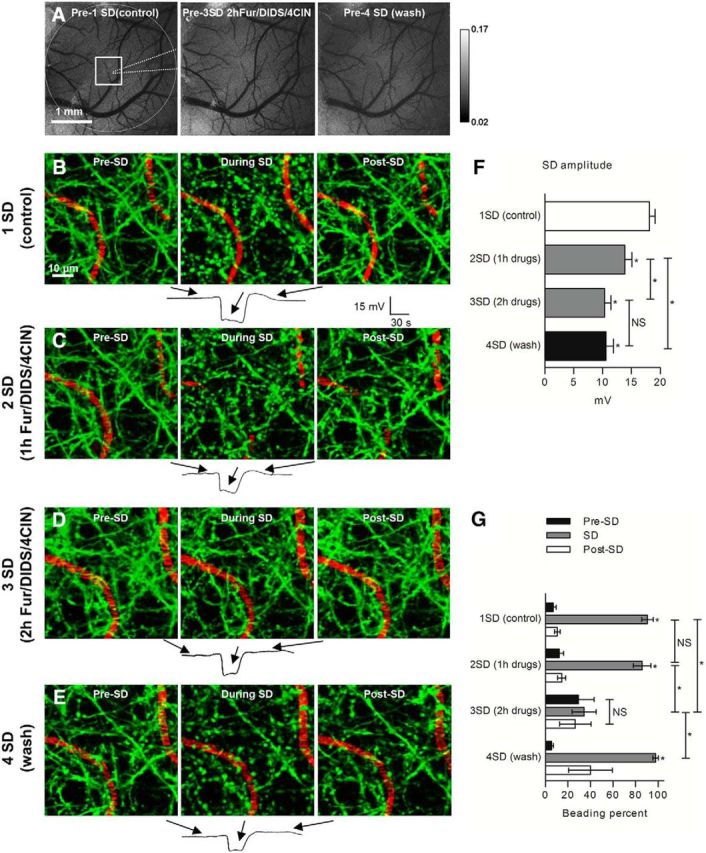
A three-drug mixture of furosemide (Fur), DIDS, and 4-CIN inhibited SD-induced dendritic beading in vivo. A, Representative grayscale sequence of laser speckle contrast images taken before induction of SDs in control, ∼2 h after drug mixture application, and 30 min after three times washout of drugs with cortex aCSF. Edges of craniotomy (dashed circle), placement of recording electrode (dotted line), and 2PLSM imaging area (square) are indicated in the control image acquired at the beginning of experiment. B, 2PLSM MIP image sequence of EGFP-positive dendrites (green) and flowing blood vessels (red) showing rapid beading and recovery of dendrites during passage of control SD. Each image corresponds with a time point indicated on the respective SD recording from a glass microelectrode placed next to imaged dendrites. C, 2PLSM MIP image sequence shows same dendrites undergoing rapid beading during the passage of the second SD induced after ∼1 h of three-drug mixture application to the open craniotomy. D, Dendritic structure remained mostly unchanged (lack of beading) during the passage of the third SD induced after ∼2 h of three-drug mixture application. E, Wash of the exposed cortex three times with cortex aCSF once again revealed a rapidly reversible beading with the passage of SD at 30 min after wash. F, Quantification of the SD amplitudes from six mice indicates significant decrease in the subsequent SD amplitudes with no significant difference between SD elicited at ∼2 h of the three-drug mixture application and SD elicited 30 min after washout of drugs (one-way RM-ANOVA with Tukey's post hoc test). *p < 0.01. G, Quantification of SD-induced dendritic beading reveals that beading was significantly reduced after ∼2 h of three-drug mixture application (n = 6 mice). In three mice that were tested at 30 min after washing three times with cortex aCSF, the drug effect was reversible. Asterisks at the bar during SD indicate significant difference from the time points Pre-SD and Post-SD. The amount of beading during the third SD elicited in the three-drug mixture was not significantly different from Pre-SD and Post-SD (one-way RM-ANOVA with Tukey's post hoc test). Asterisks above the braces indicate significant difference between the amount of beading during SD elicited at ∼2 h in drug mixture from SDs elicited at all other time points during the experiment (one-way RM-ANOVA with Tukey's post hoc test). *p < 0.001.