Figure 1.
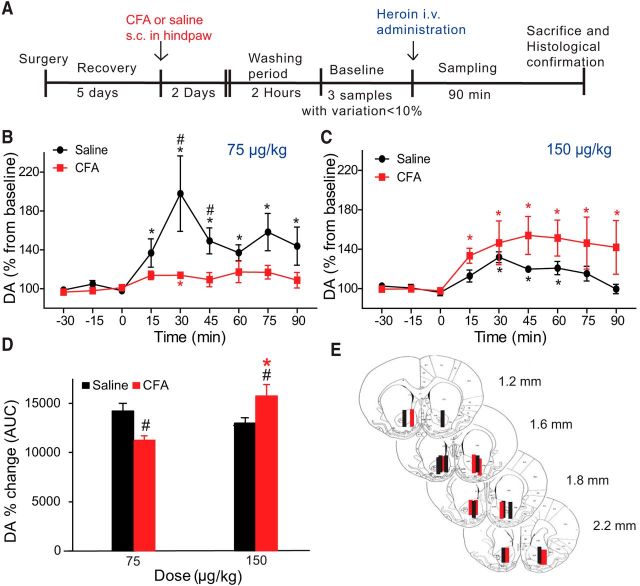
Inflammatory pain alters heroin-evoked release of DA in the NAc. A, Schematic of the experimental design for microdialysis experiments. Effect of 75 μg/kg (B) and 150 μg/kg (C) intravenous heroin administration on DA levels in control (black) and in CFA-treated (red) animals. Data are mean ± SEM represented as percentage from baseline; n = 5 or 6 per group. Heroin was administered at time 0. *p < 0.05, significant differences from baseline (Dunnett's test). #p < 0.05, significant differences between the two groups at a time point after heroin administration (two-way ANOVA with repeated measures followed by Bonferroni multiple comparisons). D, Percentage change in DA levels induced by heroin calculated as AUC from 0 to 90 min for control (black) and CFA-treated (red) animals at the two doses of heroin tested. At 75 μg/kg of heroin, the AUC value was significantly lower in CFA-treated animals compared with control animals. #p < 0.05 (two-way ANOVA followed by Bonferroni multiple comparisons). Doubling the heroin dose in CFA-treated rats increased the value of the AUC significantly (*p < 0.05) but did not change the value obtained in control rats receiving 75 μg/kg. The AUC for CFA-treated rats receiving 150 μg/kg heroin is significantly higher versus AUC for control rats receiving 150 μg/kg heroin (#p < 0.05). E, Diagram of coronal sections indicating the placement of microdialysis probes in the NAc core. Probe locations for control (black) and CFA-treated (red) rats receiving 75 μg/kg of heroin are represented in the left hemisphere, whereas probe locations for control and CFA-treated rats receiving 150 μg/kg of heroin are represented in the right hemisphere. In some cases, one plotted line corresponds to more than one dialysis membrane. Numbers to the side of the coronal sections indicate distance anterior to bregma. Adapted from the rat brain atlas of Paxinos and Watson (2007).

