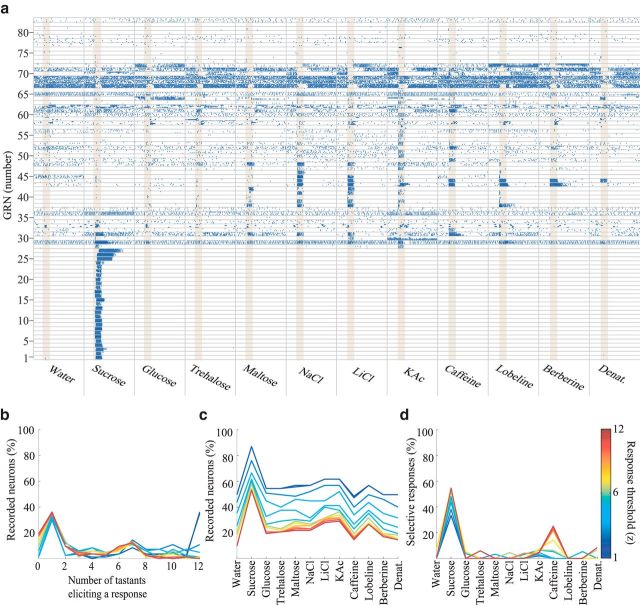
Figure 2.
Tastant-elicited responses of GRNs are diverse and specific. a, Raster plots represent responses of all 83 tested neurons (rows) to 12 tastants (columns, 4 trials/tastant shown, of 4 trials for water, 7 trials of all other tastants), ordered approximately by response characteristics. Yellow shading represents tastant presentation, 1 s. For examples of spike sorting, see Figure 6. b–d, Summary of GRN responses shown in a. All plots represent binary response classifications for a broad range of response-detection thresholds (1–12; see Materials and Methods). b, Percentage of GRNs responding to different numbers of tastants. c, Percentage of GRNs responding to each tastant. d, Percentage of GRNs responding exclusively to each tastant.

