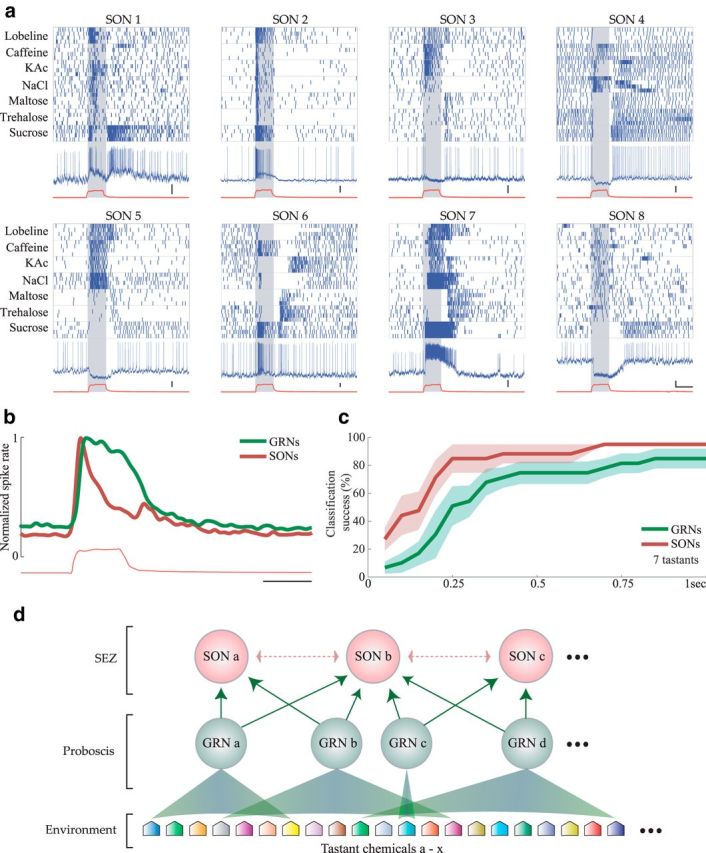
Figure 7.

Spatiotemporal response properties of SONs. a, Raster plots of 8 example SONs responding with temporally structured firing patterns to various tastants. Blue and red traces and gray shading as in Figure 6c. Calibration: vertical = 10 mV, horizontal = 1 s. b, Histogram represents the average spiking response of GRNs (green, n = 83) and SONs (red, n = 13) elicited by 1 s delivery of the 7 tastants shown in a. Spiking responses were smoothed with a Gaussian filter (SD 60 ms) and normalized to show equal maximum average spike rates. Red trace represents average color sensor voltage. Calibration: 1 s. c, Given the same tastant set, SONs provided faster and more accurate tastant classification with fewer cells than GRNs. Comparison of 7-way classification using the GRN (n = 83, green) and SON responses (n = 13, red). Plots represent mean ± SEM. d, Schematic summary of our findings. Various tastant chemicals in the environment (24 examples are illustrated) are detected in the proboscis by GRNs that have overlapping sensitivities that range from narrow (GRN c) to broad (GRN d) (see Fig. 2a). Multiple GRNs converge upon each SON in the SEZ (see Fig. 6). We hypothesize that excitatory and inhibitory SONs (dotted arrows) may interact with each other, leading to elaborately structured firing patterns (a).
