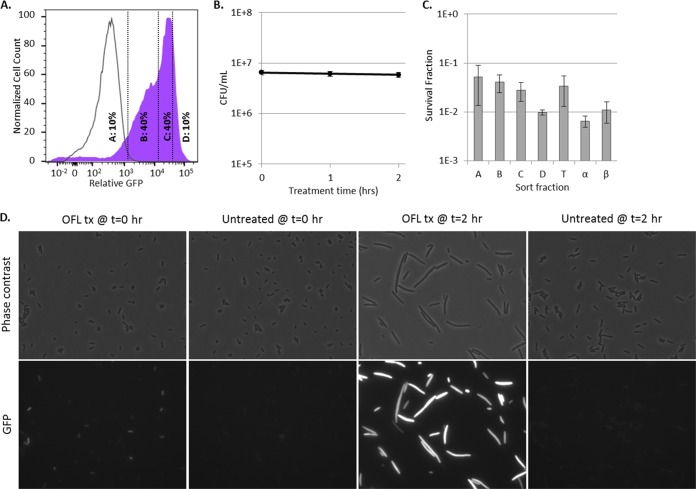
FIG 3 .
Persisters and nonpersisters induce an impressive SOS response within 2 h of recovery in liquid medium. (A) Shaded purple curve, WT containing PrecA-gfp treated in stationary phase for 5 h with ofloxacin, followed by 2 h of recovery in antibiotic-free LB medium. Unshaded curve, same as purple curve, except that the ΔrecA mutant containing PrecA-gfp was used. Vertical lines indicate the FACS gating strategy used. Additional controls are provided in Fig. S6 in the supplemental material. (B) The number of CFU per milliliter remained unchanged through 2 h of recovery in fresh LB medium. Numbers of CFU per milliliter are reported as average values ± the minimum and maximum values of two biological replicates. (C) Survival fractions from the A, B, C, and D gates designated in panel A. T, total population (all gates); α, pre-FACS control; β, post-FACS control. Survival fractions were calculated relative to the cell density of sorted samples, 3 × 10⁵ cells/ml. Data are average values ± standard errors from at least three biological replicates. (D) WT morphology and induction of PrecA in cells subjected to ofloxacin treatment (OFL tx) for 5 h in stationary phase after transfer to antibiotic-free LB medium for 0 and 2 h, along with untreated controls. Controls demonstrating that PrecA induction and filamentation are RecA dependent are provided in Fig. S6 in the supplemental material. All images are 87.36 by 66.56 µm.

