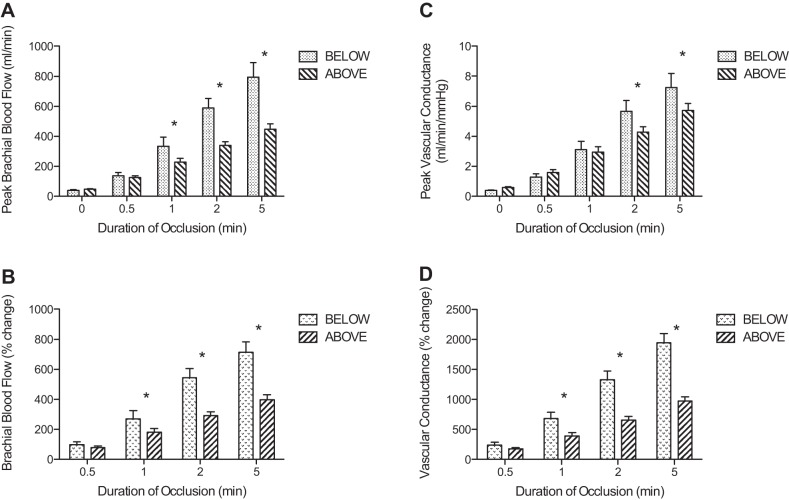
Fig. 2.
Peak brachial blood flow (A), peak vascular conductance (C), percentage change in peak brachial blood flow (B), and percentage change in vascular conductance (D) following release of cuff pressure after varying periods of occlusion. In A and C, 0 represents the values prior to occlusion. The graph compares the responses when the experimental arm was positioned above the heart vs. below the heart. *Significant differences between above and below (P < 0.05).

