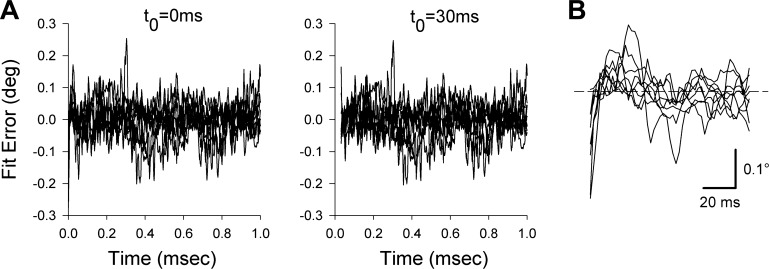
Fig. 5.
A: comparison of instantaneous fit errors when a 2-term exponential fit to the 520-ms train data is initiated at the moment of maximal recoil eye velocity (t0 = 0 ms) vs. 30 ms later (t0 = 30 ms). The t0 = 30 ms plot is shifted rightward 30 ms so that timing of the residuals in the 2 panels is comparable. In contrast to equivalent plots in the monkey, delaying the onset of fitting did not improve the instantaneous errors. B: the first 100 ms of the residuals of the t0 = 0 ms plot from A, at an expanded scale. Horizontal cursor indicates 0 fitting error.

