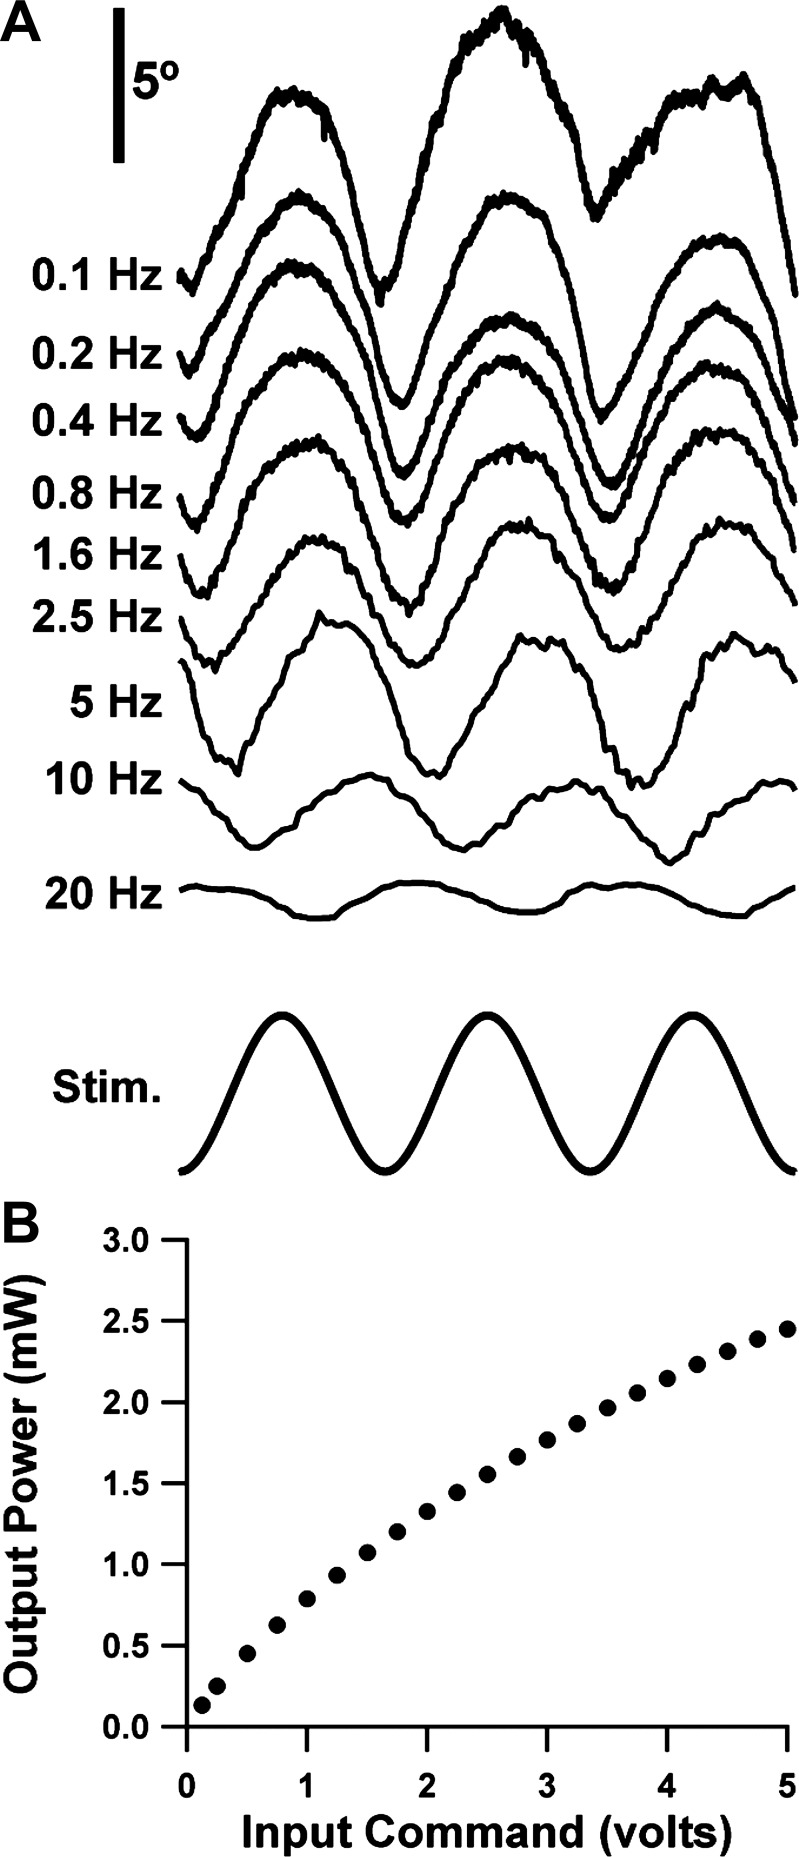
Fig. 6.
A: typical examples of the steady-state response to the sinusoidal photostimulus to each stimulus frequency. Abscissa is calibrated in number of cycle periods to facilitate comparison across stimulus frequencies. All traces share the same vertical scaling. Upward trace deflections correspond to abduction. B: luminous power of the Thorlabs M470F1 LED source (in mW) as a function of command voltage.

