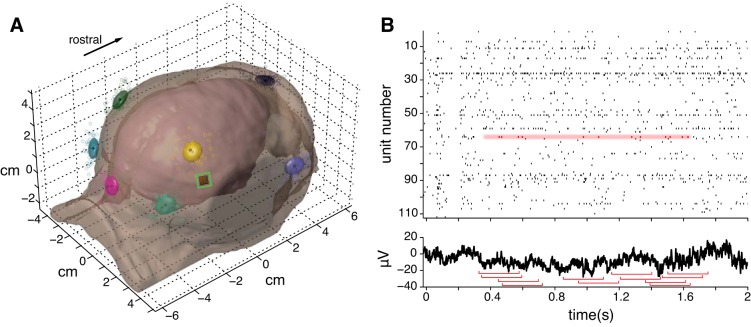
Fig. 1.
A: model of a representative subject's head derived from an MRI with coregistered electrode positions (colored scatter points). Each color represents a different position, and each marker of a given color represents a separate recording session. The corresponding ellipsoids each subtend ±1 SD of the position (∼5 mm, which was the electrode diameter) along each of the 3 principal axes of the position distribution. Electrode position could vary based on the experimenters' judgment of anatomical landmarks when applying the electrodes and noise in the position digitizer system. The points by the left lateral canthus are occluded in this view. Unless otherwise specified, EEG data from the right parietal electrode (yellow) are depicted in subsequent figures. The microelectrode array is shown to scale positioned in right V4 outlined by the green square. This image is reproduced from Fig. 1b in Snyder et al. (2015) with permission. B: example raw data from a single trial, illustrating the sampling procedure for spike-triggered averaging. Top: we excluded spikes from analysis that occurred near the start or end of a trial to avoid contamination by transient events around trial boundaries; the valid time points for an example neuron (unit 64) are highlighted in red in the raster. Bottom: we took a 500-ms window of EEG data (red brackets) centered at the time of each valid spike and averaged together all the windows from all trials to derive the spike-triggered average (STA).

