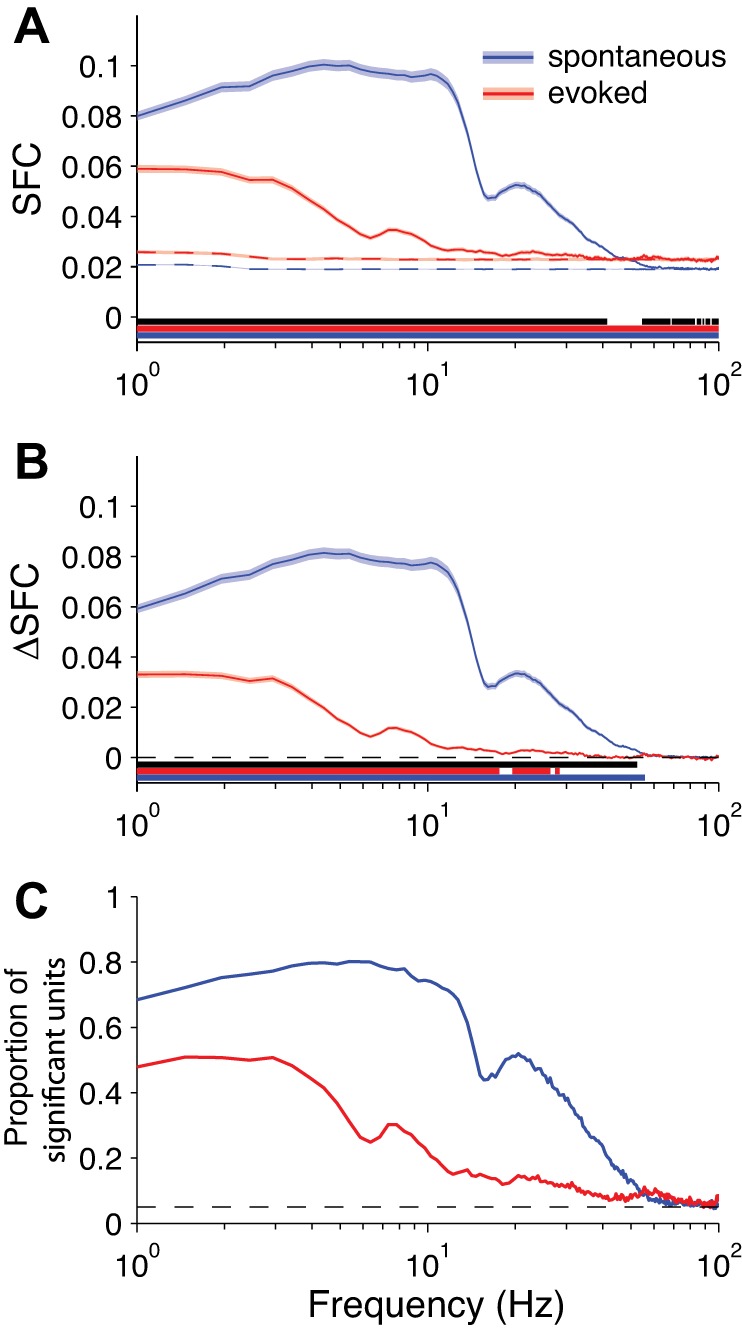
Fig. 10.

SFC for LFP. A: solid lines: grand-averaged SFC over all neurons (spontaneous: n = 1,220 neurons; evoked: n = 1,326 neurons; shading represents ±1 SE). Dashed lines: SFC for trial-shuffled data, capturing measurement bias (shading represents 90% confidence interval). Underlining indicates statistical significance at each frequency (blue and red underlines: 1-sample t-test for spontaneous and evoked SFC, respectively, against a null hypothesis of 0; black underline: independent-samples t-test for the difference between conditions). B: same as in A but with the trial-shuffled values subtracted from the raw values (i.e., ΔSFC), correcting for measurement bias. C: proportion of neurons at each frequency with significant SFC (by permutation test using trial-shuffled data). Dashed line reflects the false-positive rate of P = 0.05.
