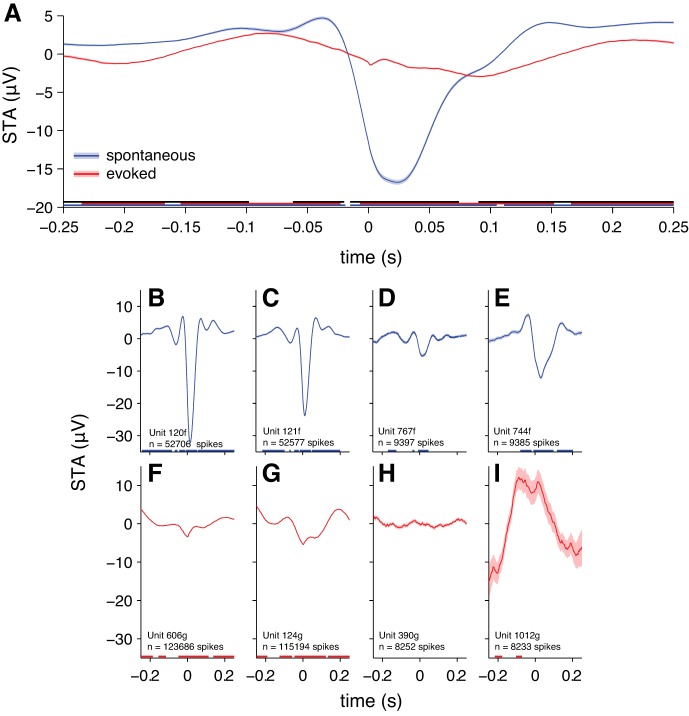
Fig. 14.
Spike-triggered average LFP. A: grand-averaged STA over all neurons (spontaneous: n = 1,220 neurons; evoked: n = 1,326 neurons). Shading represents ±1 SE, although SE may appear narrower than line width at some points. B–I: spike-triggered average EEG for example individual neurons. B–E: neurons recorded during the spontaneous condition. F–I: neurons recorded during the stimulus-evoked condition. The same example neurons were depicted in previous figures of single-neuron data.

