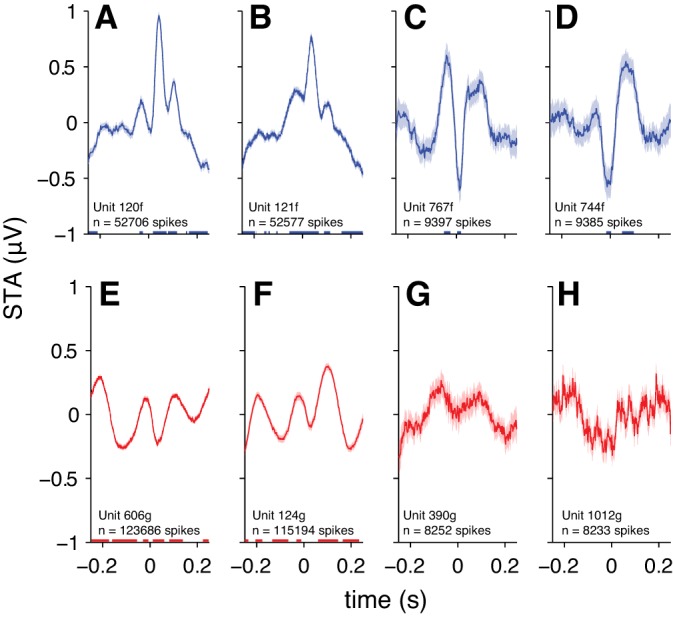
Fig. 3.

Spike-triggered average EEG for example individual neurons. Shading represents ±1 SE. Underlining represents significant time points (1-sample t-test, α = 0.05, Bonferroni corrected for the number of time points). A–D: neurons recorded during the spontaneous condition. E–H: neurons recorded during the stimulus-evoked condition. Neurons in A, B, E, and F are the neurons with the greatest observed spike counts. Neurons in C, D, G, and H are neurons with spike counts around the 75th percentile for the sample.
