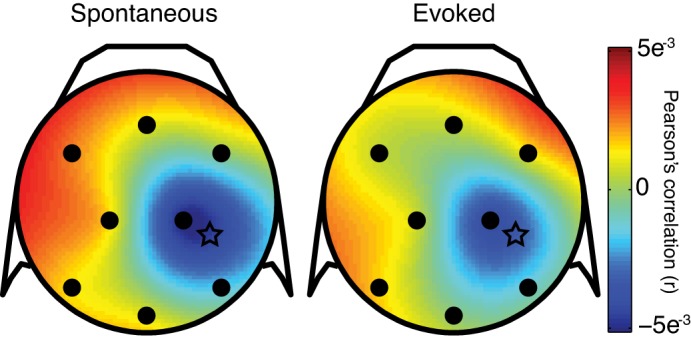
Fig. 7.

Spline-interpolated topographical map of correlation between scalp EEG and multiunit activity recorded from the array in right V4. Correlations between multiunit and broadband EEG were calculated on each trial, averaged over trials in each session, and then grand-averaged across session for each condition. Stars represent the approximate array location projected onto the 2-dimensional scalp map.
