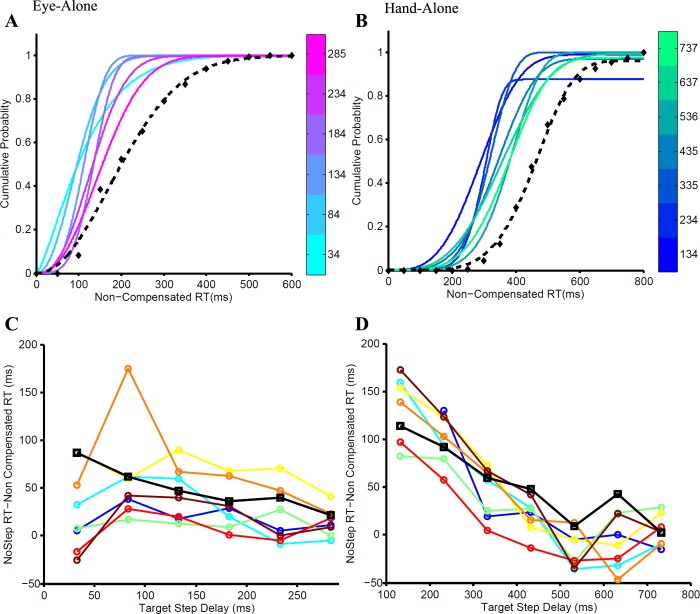
Fig. 3.
Validating the race model framework. The fanning effect is the progressive shift of the cumulative distributions of noncompensated reaction times (RTs) at each TSD (graded colors) toward the cumulative no-step RT distribution (dashed black line). A: fanning effect for the eye-alone condition in which TSDs ranging from 34 to 285 ms in steps of 50 ms are shown as graded colors from cyan to magenta. B: fanning effect for the hand-alone condition in which TSDs ranging from 134 to 737 ms in steps of 100 ms are shown as graded colors from blue to green. The fanning effect is quantified as the difference between the median no-step RT and the median of the noncompensated trials at each TSD. This difference decreases with increasing TSD, as shown across subjects (separate colors) for the eye-alone (C) and hand-alone (D) conditions.

