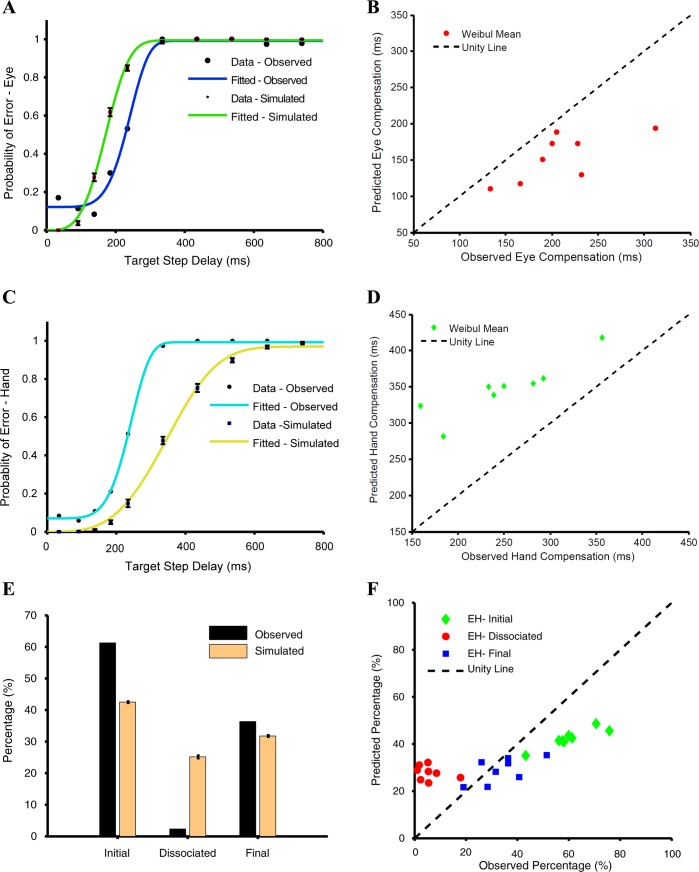
Fig. 5.
Validating the independent model. A: comparison between the predicted (green) and observed (blue) compensation function fitted using a cumulative Weibull function for the eye. The data points (large symbols) constituting the fit are also plotted. The predicted (small) data points along with their 95% confidence interval (bars) are shown for reference. B: scatter plot of the Weibull means calculated separately from the observed and predicted compensation functions of the eye. Data points are below the unity line (dashed black), suggesting underestimation by the model. C: comparison between the predicted (light green) and observed (cyan) compensation functions fitted using a cumulative Weibull function for the hand. The data points (black circles) observed are also plotted. The predicted (black squares) data points along with their 95% confidence interval (bars) are also shown for reference. D: scatter plot of the Weibull means calculated separately from the observed and predicted compensation functions of the hand. Data points are above the unity line (dashed black), suggesting overestimation by the model. E: predicted (orange) and observed (black) frequencies of EH-initial, EH-dissociated, and EH-final trials for a typical subject. F: scatter plot showing relationship between the predicted and observed frequencies of EH-initial (green), EH-dissociated (red), and EH-final (blue) trials across subjects. The unity line (dashed black) is shown for reference.

