Fig. 7.
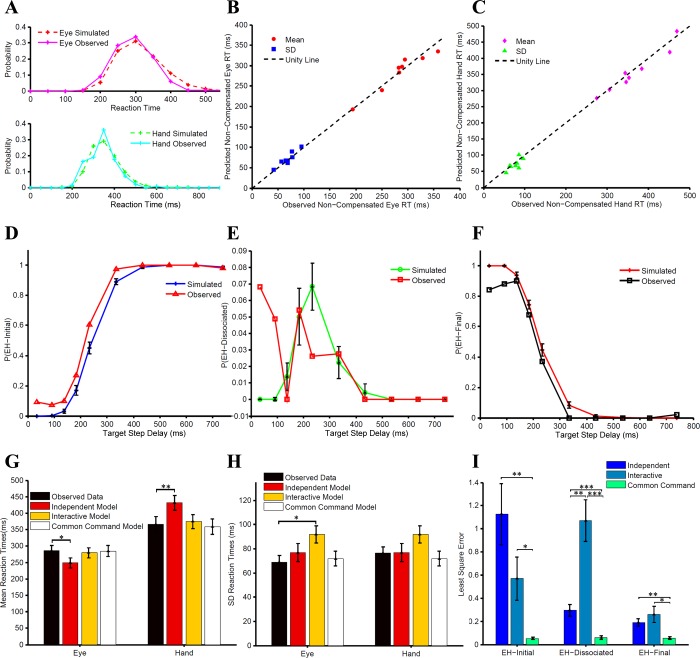
Testing the common command model. A: comparison between the predicted (dashed red) and observed (magenta) RT distributions of noncompensated trials for the eye in a typical subject (top) and similar comparison between the predicted (dashed green) and observed (cyan) RT for the hand (bottom). B: scatter plot of the means (red circles) and SDs (blue squares) between observed and predicted RT distributions of noncompensated trials for the eye across subjects. The data points are close to the unity line (dashed black), suggesting the validity of the model. C: scatter plot of the means (pink diamonds) and SDs (green triangles) between observed and predicted RT distributions of noncompensated trials for the hand across subjects. The data points are close to the unity line (dashed black), suggesting the validity of the model. D: probability of EH-initial trials as a function of TSD that is observed (red) and predicted (blue) by the model. E: probability of EH-dissociated trials as a function of TSD that is observed (red) from the data and predicted (green) by the model. F: probability of EH-final trials as a function of TSD that is observed (black) from the data and predicted (red) by the model. G and H: comparisons of the observed and predicted means (G) and SDs (H) of the noncompensated RT distributions of eye and hand predicted by the 3 models. I: comparison of the least square error between the predicted and the observed relationship of frequency of trial types with TSDs. *P <0.05; **P < 0.01; ***P < 0.001.

