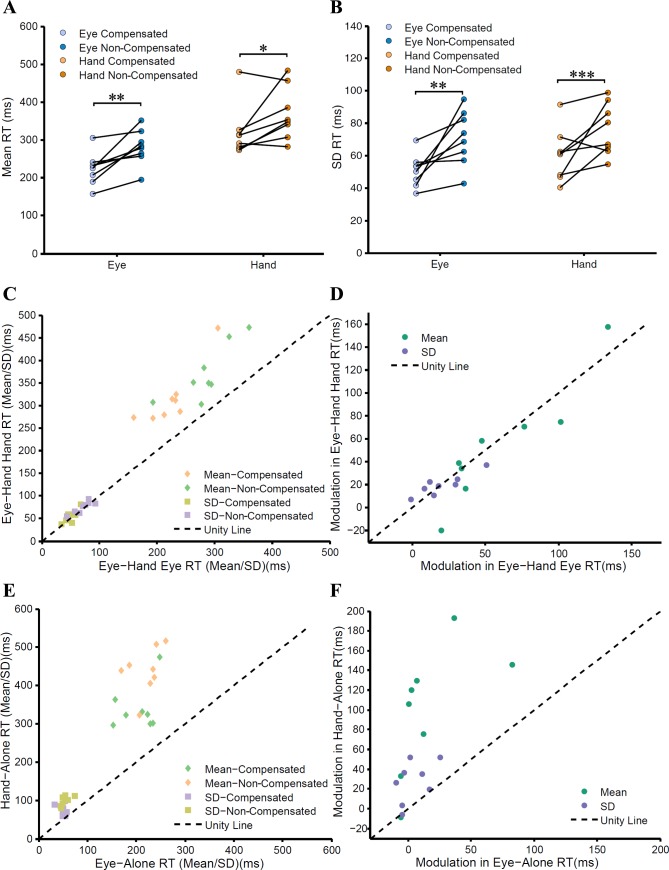
Fig. 8.
Testing the predictions of the common command model. A and B: means (A) and SDs (B) of the RT distributions of the eye (blue) and hand (orange) during compensated (light colors) and noncompensated trials (dark colors). Data from the same subjects are denoted by connecting black lines. C: scatter plot showing relationship between the means (diamonds) and SDs (squares) of the eye and hand RTs during compensated and noncompensated trials for the eye-hand condition. The unity line (black dashed line) shows that the means of the hand RTs are greater than those of the eye RTs, whereas the SDs are comparable. D: change in mean (green) and SD (violet) of the RT distributions between compensated and noncompensated conditions in the eye plotted against changes in the corresponding mean and SD of hand RT distributions across the same conditions. The data points follow the unity line, indicating that the extent of change in eye and hand effectors is comparable and well correlated for the eye-hand condition. E: in contrast, during the alone condition, the means (diamonds) and SDs (squares) of the hand RTs are greater than those of the eye RTs, and their corresponding changes are not comparable (F). *P <0.05; **P < 0.01; ***P < 0.001.

