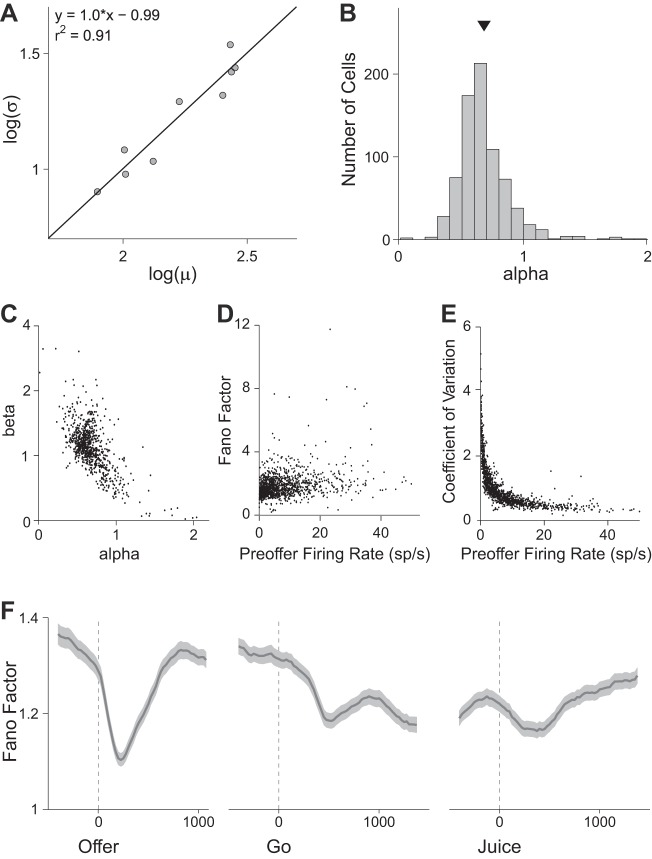
Fig. 2.
Neuronal variability in the orbitofrontal cortex (OFC). A: relation between mean firing rate (μ) and variance (σ) for one representative offer value cell (postoffer time window). Data are plotted in log scale, and each data point represents one trial type. The line is obtained from Deming's regression. For this response, αw = 1.0 and βw = −0.99. For each tuned cell (763 cells total), α and β were obtained averaging αw and βw across time windows. B: distribution of α. Across the population, mean(α) = 0.679 ± 0.008 (SE). C: relation between α and β. Each data point represents one neuron, and the two quantities are strongly anticorrelated. One outlier fell outside the range shown. D: relation between the Fano factor and the baseline activity. Baseline activity was defined as the firing rate in the preoffer time window. Each data point represents one neuron. Across the population, mean(Fano factor) = 1.8. E: relation between coefficient of variation (cv) and baseline activity. The two quantities are strongly anticorrelated. Across the population, mean(cv) = 1.0. F: time course of neuronal variability. Dark lines and shaded regions represent, respectively, the mean Fano factor and the corresponding SE (in sp/s). The Fano factor was calculated in 200-ms sliding windows. Neuronal variability dropped sharply shortly after the offer onset; it returned to the initial levels 500–700 ms after the offer; it decreased again and more mildly following the go signal and remained depressed until the trial end. The coefficient of variation presented a similar time course (data not shown).

