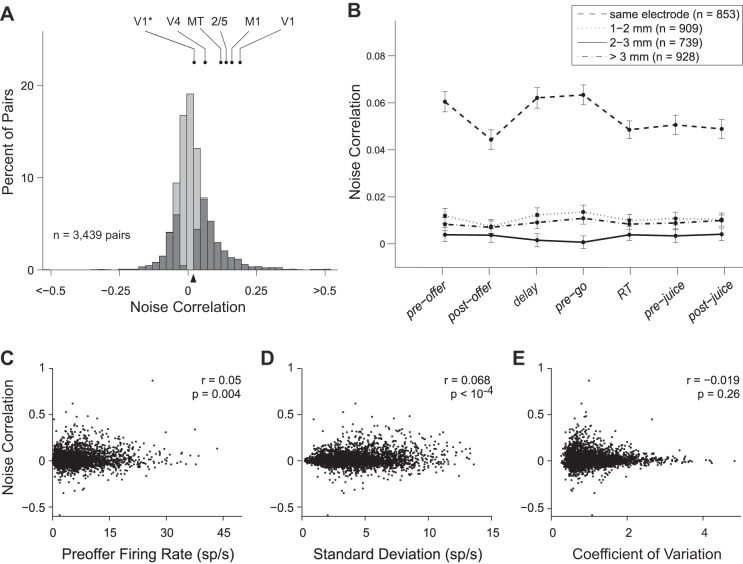
Fig. 3.
Noise correlation (rnoise) between pairs of neurons in OFC. A: overall distribution of rnoise. In this plot, we pooled all cell pairs and all time windows. Cell pairs with significant rnoise are indicated in dark. The rnoise differed significantly from zero for 1,592/3,439 (46%) cell pairs (P < 0.05; bootstrap analysis; see materials and methods). The black triangle below the x-axis marks the population average. For comparison, we indicate measures of noise correlation previously reported for middle temporal (MT) (Zohary et al. 1994), parietal areas 2/5 (Lee et al. 1998), M1 (Lee et al. 1998), V4 (Mitchell et al. 2009), and V1. For V1, the higher data point shown here is from Poort and Roelfsema (2009), and comparable measures were reported (Gutnisky and Dragoi 2008; Kohn and Smith 2005; Nienborg and Cumming 2006; Smith and Kohn 2008); the lower data point is from Ecker et al. (2010), and a comparable measure was reported (Ecker et al. 2014). B: values of rnoise grouped by interelectrode distance. The x-axis represents different time windows (see materials and methods). For all time windows, rnoise was significantly higher when the two cells were recorded from the same electrode. Notably, rnoise did not decrease beyond values measured at 1-mm distance. Error bars indicate SE. C: noise correlation as a function of the geometric mean of baseline firing rates. The geometric mean averaged across the population was 5.85 ± 0.09 sp/s (mean ± SE). Across the population, noise correlations were weakly but significantly correlated with the geometric mean of baseline firing rates (r = 0.05, P < 0.005; Spearman rank correlation). D: noise correlation as a function of the geometric mean of SDs. Population mean ± SE = 4.20 ± 0.04 sp/s. E: noise correlation as a function of the geometric mean of the coefficients of variation. Population mean ± SE = 1.048 ± 0.009. Data for C–E were taken from the preoffer time window. Note that values of rnoise for individual cell pairs fluctuate throughout the course of the trial and are negatively correlated with firing rate across time windows (see Fig. 4).

