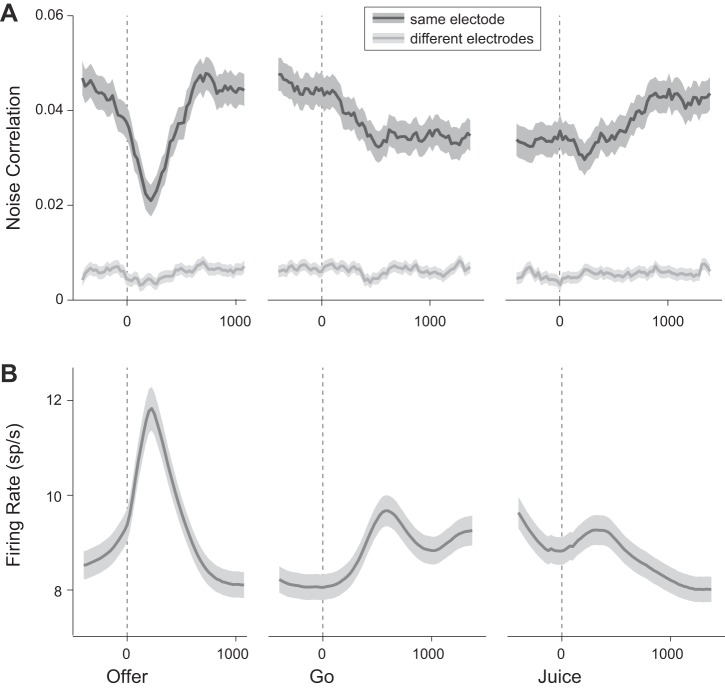
Fig. 4.
Time course of noise correlation and firing rate. A: noise correlation. Values of rnoise were computed in 200-ms time windows slid by 25-ms intervals around offer presentation (left), go signal (middle), and juice delivery (right). Each data point is placed on the x-axis in the center of the corresponding time window. Dark lines and shaded regions indicate mean(rnoise) and SE, respectively. Noise correlations dropped sharply and transiently after the offer. This effect, most evident when neurons were recorded from the same electrode, was also observed when neurons were recorded from different electrodes. A second and more modest decrease in rnoise occurred after the go signal. This second drop was pronounced only in same-electrode pairs. Noise correlations gradually returned to baseline levels after juice delivery. All cell pairs in the dataset are included (863 same-electrode pairs, dark gray; 2,576 different-electrode pairs, light gray). B: firing rate. Shown is the firing rate averaged across all tuned cells (763 cells). All conventions as in A.

